
Fig. 1
- ID
- ZDB-FIG-220720-95
- Publication
- Tamai et al., 2022 - Acute cold stress induces transient MuRF1 upregulation in the skeletal muscle of zebrafish
- Other Figures
- All Figure Page
- Back to All Figure Page
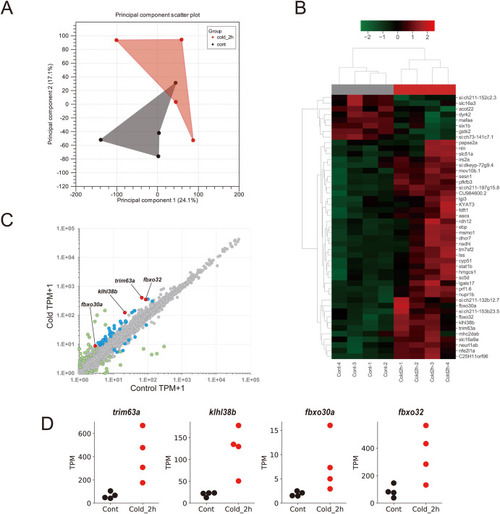
Fig. 1. Result of mRNA-seq. Eight RNA samples including both conditions and gender (cold/control [cont] and male/female; n = 2 for each). A. Principal component analysis displaying the projection of the sample onto a two-dimensional scatter plot by the first and second principal components. B. Heatmap presenting DEGs for each sample (control and cold_2h). C. Scatter plot presenting the mean log2 gene expression in the control and cold_2h groups. Green dots indicate excluded genes because of standard deviation > 1, blue dots indicate DEGs, and red dots indicate genes related to protein ubiquitination. D. Dot plots indicating the gene expression of trim63a, klhl38b, fbxo30a, and fbxo32. |