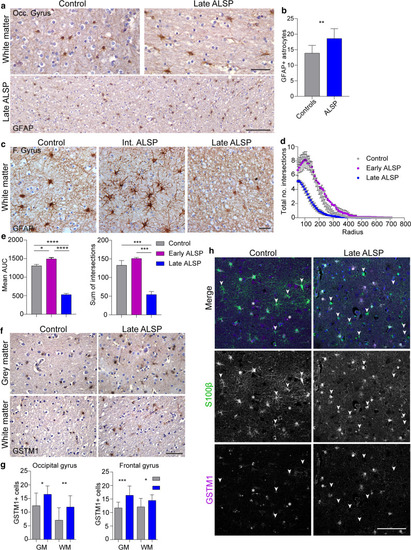
Abnormal astrocytic morphology and astrocyte-specific expression of GSTM1 in ALSP. a Representative images of occipital gyrus tissue of late-ALSP patients (n = 2) and controls (n = 2) stained with GFAP to visualize astrocytes in the white matter. b Quantification of the number of GFAP + astrocytes in the white matter of the occipital gyrus, based on five images/donor (n = 2/group). c Representative images of the white matter of the frontal gyrus stained with GFAP in intermediate-stage ALSP patients (n = 2), late-stage ALSP patients (n = 6) and controls (n = 3). d Sholl plot of GFAP + astrocytes found in the white matter of the frontal gyrus showing the total number of intersections per radius in intermediate and late ALSP vs control. e Quantifications of Sholl analysis on GFAP + astrocytes showing the mean area under the curve (AUC) (left) and total sum of intersections (right). f Representative images of GSTM1 staining of occipital gyrus tissue of late-ALSP patients (n = 2) and controls (n = 2) stained in the grey matter (top), white matter (bottom) and frontal gyrus of late-ALSP patients (bottom). g Quantification of the number of GSTM1 + cells in the grey and white matter of the occipital gyrus (left) and the frontal gyrus (right). Each dot represents the total number of GSTM1 + cells in one image, six images/donor (n = 2/group). h Representative images of frontal gyrus tissue of ALSP patients (n = 2) and controls (n = 2) stained with S100β (green), to visualize astrocytes, and GSTM1 (magenta). White arrows represent S100β + GSTM1- astrocytes; white asterisks represent S100β- GSTM1 + cells. Frontal (F.), grey matter (GM), Occipital (Occ.), white matter (WM). One-way or two-way ANOVA test was preformed to test for significance (p < 0.05). Error bars represent SD and SEM (d). *p < 0.05, **p < 0.01 ***p < 0.001 ****p < 0.0001. Scale bars equal 10 μm (a, upper panel), 100 μm (a, lower panel; h), 20 μm (c, f)
|
