
Fig. 1
- ID
- ZDB-FIG-220628-149
- Publication
- He et al., 2021 - Zebrafish foxc1a controls ventricular chamber maturation by directly regulating wwtr1 and nkx2.5 expression
- Other Figures
- All Figure Page
- Back to All Figure Page
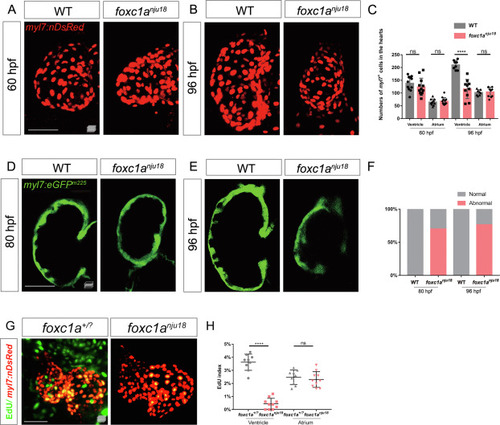
Fig. 1. Ventricular development defects are observed during the trabecular stage in foxc1anju18 mutants. A: Maximum intensity projections of confocal z-stacks show representative ventricles of 60 hpf Tg(myl7:nDsRed);foxc1a+/+ (n = 11) and Tg(myl7:nDsRed);foxc1anju18 (n = 12) embryos. B: Maximum intensity projections of confocal z-stacks show representative hearts of 96 hpf WT (n = 8) and foxc1anju18 (n = 10) embryos. C: A scatter plot shows the numbers of cardiomyocytes in the atria and ventricles. D: Midsagittal confocal images show hearts of 80 hpf Tg(myl7:eGFP)m225;foxc1a+/+ (n = 14) and Tg(myl7:eGFP)m225;foxc1anju18 (n = 10) embryos. E: Midsagittal confocal images show hearts of 96 hpf Tg(myl7:eGFP)m225; foxc1a+/+ (n = 13) and Tg(myl7:eGFP)m225;foxc1anju18 (n = 17) embryos. F: Statistical analysis of data derived from (D) and (E). G: Maximum intensity projections of confocal z-stacks show representative EdU-stained hearts from 84 hpf Tg(myl7:nlsRed);foxc1a+/? (n = 9) and Tg(myl7:nDsRed);foxc1anju18 (n = 10) embryos. H: A scatter plot shows the percentage of EdU+ cells. Scale bars, 50 μm. ns, P > 0.05; ∗∗, P < 0.01; ∗∗∗, P < 0.001; ∗∗∗∗, P < 0.0001. Error bars represent the standard deviation. hpf, hour postfertilization. |
| Genes: | |
|---|---|
| Fish: | |
| Anatomical Terms: | |
| Stage Range: | Pec-fin to Day 4 |
| Fish: | |
|---|---|
| Observed In: | |
| Stage Range: | Pec-fin to Day 4 |
Reprinted from Journal of genetics and genomics = Yi chuan xue bao, 49(6), He, L., Zhang, Q., Jiang, D., Zhang, Y., Wei, Y., Yang, Y., Li, N., Wang, S., Yue, Y., Zhao, Q., Zebrafish foxc1a controls ventricular chamber maturation by directly regulating wwtr1 and nkx2.5 expression, 559-568, Copyright (2021) with permission from Elsevier. Full text @ J. Genet. Genomics