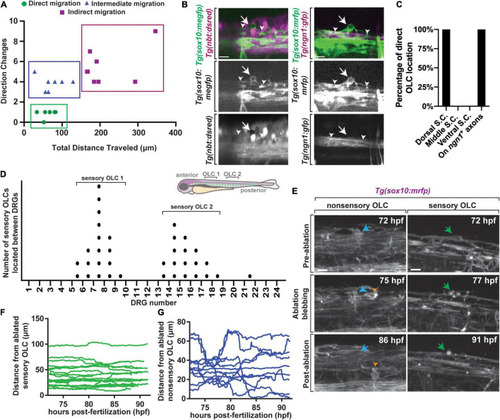
A distinct population of OPCs associates with sensory nerves. (A) Plot of individual OPCs with less direct migration versus individual OPCs with a more direct migration. Green dots denote OPC that migrate less and directly. Blue dots denote OPC with longer distances of migration. (B) Confocal z-stack images from Tg(sox10:megfp);Tg(nbt:dsred) and Tg(ngn1:gfp);Tg(sox10:mrfp) animals at 72 hpf showing that dorsal migrating oligodendrocytes associate specifically with sensory neurons. White arrow represents oligodendrocyte associated with sensory neurons and white arrowheads represent sensory axons. (C) Quantification of the percentage of OLCs located across specific regions in the spinal cord. (D) Quantification of the number of sensory OLs located between specific DRGs. Each point represents one individual sensory OL. Zebrafish diagram in the upper right represents locations of OLC 1 and 2 along the spinal cord. (E) Images from a 24 h time-lapse starting at 72 hpf in Tg(sox10:mrfp) animals showing the ablation of sensory and non-sensory OLs and surrounding OPC response. Blue arrow represents a non-sensory OL. Green arrow represents a sensory OL. Orange arrowheads represent a responding OPC following non-sensory OL ablation. (F) Quantification of the distance surrounding OPCs traveled over time immediately following sensory OL ablation. (G) Quantification of the distance surrounding OPCs traveled over time immediately following non-sensory ablation. Scale bar equals 10 μm (B,E). All images are orientated anterior to left, posterior to right, dorsal up and ventral down.
|
