
FIGURE
Fig. 5
Fig. 5
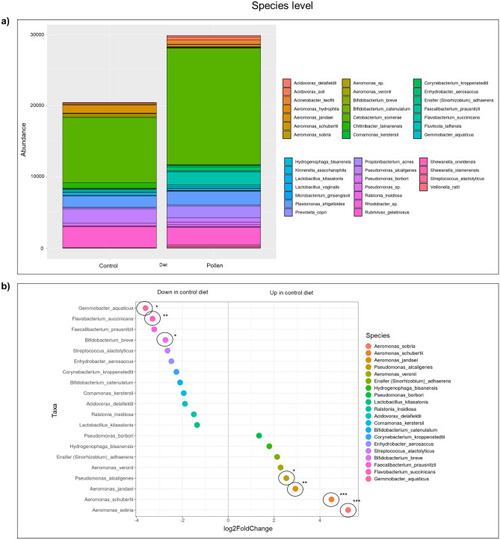
Bacterial communities at species level. (a) Stacked column bar graph showing the distribution and abundances of bacteria in zebrafish gut fed with control diet and pollen supplemented diet. (b) Dot plot graph showing significantly different abundant OTUs (*p < 0.05; **p < 0.01; ***p < 0.001), where OTUs are grouped by color along the y-axis. The x-axis indicates the log2 fold-change in control diet compared to pollen diet. |
Expression Data
Expression Detail
Antibody Labeling
Phenotype Data
Phenotype Detail
Acknowledgments
This image is the copyrighted work of the attributed author or publisher, and
ZFIN has permission only to display this image to its users.
Additional permissions should be obtained from the applicable author or publisher of the image.
Full text @ Sci. Rep.