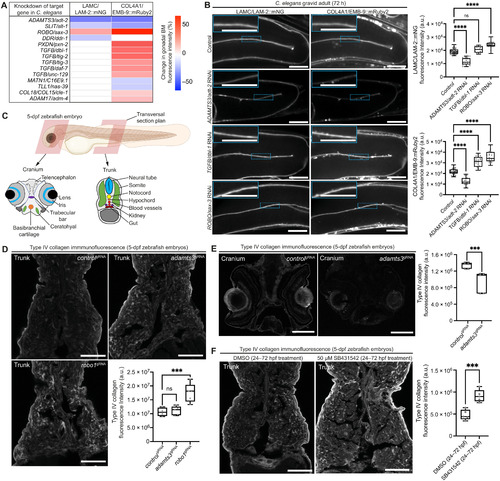
(A) Heatmap summarizing changes in LAMC/LAM-2::mNG and COL4A1/EMB-9::mRuby2 fluorescence in the gonadal BM upon target gene knockdown in C. elegans. (B) Confocal middle-plane z-slices of gonadal BM LAMC/LAM-2::mNG and COL4A1/EMB-9::mRuby2 in control and RNAi-targeted adt-2, dbl-1, and sax-3 72-hour adult animals (boxed regions are magnified in insets) with quantifications of fluorescence intensity shown on the right (n ≥ 20 each). ****P < 0.0001; ns, not significant; one-way analysis of variance (ANOVA) with post hoc Dunnett’s test. Scale bars, 25 μm. (C) Schematic of a zebrafish embryo [5 days postfertilization (dpf); Biorender] with transversal cross sections depicting tissues in the cranium and the trunk. (D) Confocal images of type IV collagen immunofluorescence in trunk sections of controlgRNA-, adamts3gRNA-, and robo1gRNA-injected 5-dpf embryos. Fluorescence intensity within the entire section is quantified on the bottom right (n = 5 for each treatment). ***P < 0.001, one-way ANOVA with post hoc Dunnett’s test. Scale bars, 30 μm. (E) Collagen IV immunofluorescence in cranial sections of controlgRNA- and adamts3gRNA-injected 5-dpf embryos with quantification of fluorescence intensity on the right (n = 5 for each treatment). ***P < 0.001, unpaired Student’s t test. Scale bars, 30 μm. (F) Collagen IV immunofluorescence in trunk sections of 5-dpf embryos treated with dimethyl sulfoxide (DMSO; control) or SB431542 (TGFBR1 inhibitor) on the left [2-day treatment between 24 and 72 hours postfertilization (hpf)]; quantification of fluorescence intensity on the right (n = 5 each). ***P < 0.001, unpaired Student’s t test. Scale bars, 30 μm. For boxplots, edges indicate the 25th and 75th percentiles, the line in the box represents the median, and whiskers mark the minimum and maximum values.
|

