|
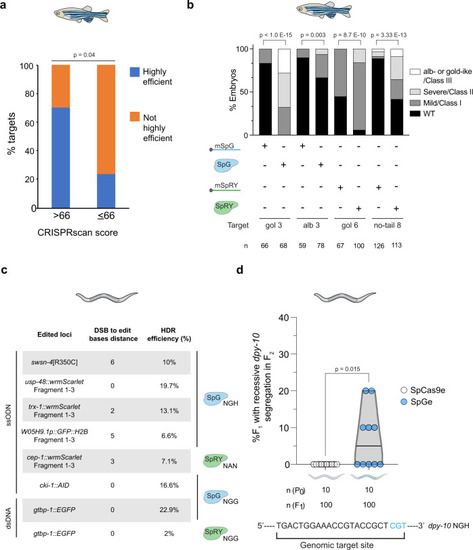
Further SpG and SpRY optimization in vivo.a Prediction of gRNA activity in vivo using CRISPRscan. Stacked barplots show the percentage of highly efficient gRNAs (blue) and not highly efficient gRNAs (orange) in two groups separated based on CRISPRscan scores (>66 and ≤66). Highly efficient gRNAs generate more than 50% of embryos with albino-like/golden-like/class III or severe/class II phenotypes and less than 10% phenotypically wild-type. Fisher test p value. b RNP can enhance SpG and SpRY activity in zebrafish. Stacked barplots show the percentage of albino-like/golden-like/class III, severe/class II, mild/class I, and phenotypically wild-type (WT) embryos 48 h post-fertilization (hpf) after injection. (n) total number of injected embryos. The results were obtained from at least two independent experiments. mSpG and mSpRY injections data from Fig. 2b, f, and RNP injections data from Supplementary Fig. 10. The χ2-test p value per comparison is shown. c Utility of SpG and SpRY for the insertion of DNA sequences via HDR. We used ssDNA (ssODN) as a donor template to produce a missense mutation in swsn-4, to introduce a gene fragment for nested CRISPR19 at usp-48, trx-1, W05H9.1, and to add a degron tag to cki-1. Information about targeted sequences, PAMs, DSB to edit distance, insert lengths, nuclease concentration used, and correct vs incorrect insertions obtained, is showed in Supplementary Data 2. d EG9615 and CER660 worms, which express SpCas9 and SpG endogenously in the germline (SpCas9e and SpGe), respectively, were injected with tracrRNA and a crRNA targeting dpy-10 with an NGH PAM. The fluorescent markers myo-2p::mCherry and myo-3p::mCherry were used as co-injection markers. F1 worms expressing mCherry in the pharynx or body wall muscle were singled out and the appearance of Dpy progeny was screened in the F2. Editing efficiency is defined as the number of F1 worms that segregate Dpy progeny in the F2 divided by the total number of separated F1s. Each dot represents the editing efficiency in each individual P0 that produced at least ten mCherry-expressing F1s. All conditions were carried out in parallel injections (Student’s t test p value).
|