
Fig. 5
- ID
- ZDB-FIG-220415-9
- Publication
- Wen et al., 2021 - Fxr signaling and microbial metabolism of bile salts in the zebrafish intestine
- Other Figures
- All Figure Page
- Back to All Figure Page
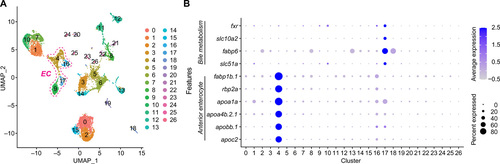
ScRNA-seq reveals extensive cellular diversity in larval zebrafish intestinal epithelium.(A) Uniform manifold approximation and projection (UMAP) visualization of cell type clusters using combined fxr+/+ and fxr−/− single-cell transcriptomes (4710 cells from fxr+/+ and 5208 cells from fxr−/−). Clusters were hierarchically ordered in principal components analysis spaces and were numbered accordingly. Detailed annotations of each cluster are shown in table S1 and Supplementary Results. Clusters 4, 16, 17, and 9 are absorptive enterocytes (EC). (B) Dot plots showing relative expression of bile salt metabolism genes and anterior enterocyte markers in fxr+/+ cells throughout all clusters. |