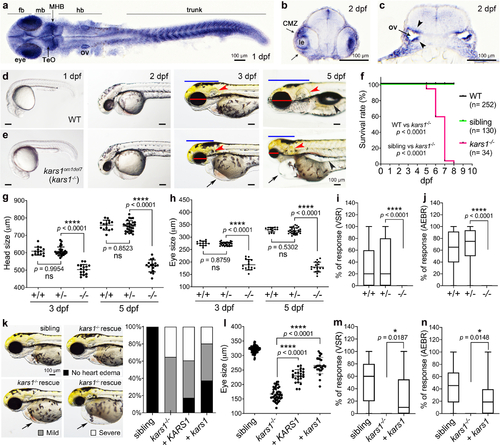
Fig. 2. Expression of kars1 messenger RNA (mRNA) in embryos and kars1 knockouts show gross morphological and behavioral defects. (a) kars1 expression in 1 days postfertilization (dpf) embryo. Dorsal view. (b,c) The cross-section of 2 dpf embryo. CMZ ciliary marginal zone, fb forebrain, hb hindbrain, le lens, mb midbrain, MHB midbrain and hindbrain boundary, ov otic vesicle, TeO optic tectum. Black arrowheads indicating the otic vesicle epithelium of otic vesicles. (d,e) Representative images of wild-type (WT) and kars1om1del7 (kars1−/−) from 1 dpf to 5 dpf. Lateral view, anterior to the left. Red lines: eye diameter. Blue lines: brain size. Red arrowheads: inner ear. Black arrows: heart edema. Black arrowhead: swim bladder. (f) Kaplan–Meier survival curves. Time is shown in days. The log rank test was used for statistical analysis. (g,h) Quantification of eye and head size from kars1+/- mutant in-cross at 3 and 5 dpf. (i,j) The visual startle response (VSR) and auditory evoked behavior response (AEBR) analyses of animals at 6 dpf from kars1+/- mutant in-cross. (k) Representative images of kars1−/− mutant rescue experiments and the quantification of heart edema phenotype. Animals were collected by defined heart edema categories at 3 dpf as shown in pictures and calculated in percentage of total animals. (l) Eye size quantification of mRNA rescue experiments at 5 dpf. (m,n) The VSR and AEBR analyses after RNA rescue at 6 dpf. n = number of animals. In (g,h,l), each dot represents one animal and error bars are presented as mean ± SD. One-way analysis of variance (ANOVA) with Tukey’s multiple comparisons test: ****p < 0.0001. In (i,j,m,n), data are plotted by box and whiskers plot and error bars indicate values from minimum to the maximum. Two-tailed unpaired t-test with Welch’s correction: ns, not significant p ≥ 0.05, *p < 0.05 and ****p < 0.0001.
|

