
FIGURE
Fig. 5.
- ID
- ZDB-FIG-220225-9
- Publication
- Diamond et al., 2022 - Computational anatomy and geometric shape analysis enables analysis of complex craniofacial phenotypes in zebrafish
- Other Figures
- All Figure Page
- Back to All Figure Page
Fig. 5.
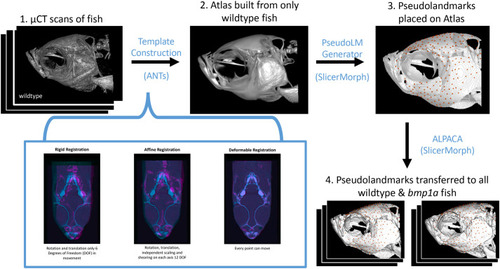
Pipeline for atlas building, pseudo-landmark generation, and transferring pseudo-landmarks to individual fish. Blue text notes the software used between each step. (1) Starting with µCT scans of wild-type fish, ANTs uses a series of rigid, affine, and deformable registrations to create an average image, or (2) Atlas. The PseudoLMGenerator tool in SlicerMorph was used to (3) place 372 pseudo-landmarks on the atlas. The ALPACA tool in SlicerMorph was used to (4) transfer points from the atlas to wild-type and bmp1a fish for comparisons between groups. |
Expression Data
Expression Detail
Antibody Labeling
Phenotype Data
Phenotype Detail
Acknowledgments
This image is the copyrighted work of the attributed author or publisher, and
ZFIN has permission only to display this image to its users.
Additional permissions should be obtained from the applicable author or publisher of the image.
Full text @ Biol. Open