FIGURE 4
- ID
- ZDB-FIG-220209-37
- Publication
- Smeeton et al., 2022 - Regeneration of Jaw Joint Cartilage in Adult Zebrafish
- Other Figures
- All Figure Page
- Back to All Figure Page
|
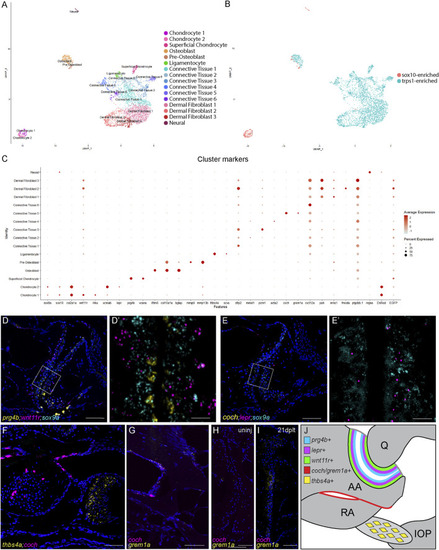
Single-cell transcriptome of adult zebrafish jaw joint. (A, B) UMAP visualization of scRNAseq analysis of FACS-sorted 3-month-old jaw joints. The colors were based on clustering (A) or library of origin (B). (C) Dot plot showing the marker gene expression for each cell cluster as well as DsRed and GFP transcripts. (D–G) RNAscope in situ hybridization for markers for chondrocyte clusters (D,E), for CT5 (coch) and ligament (thbs4a) (F), and for CT5 (coch and grem1a) (G). Nuclei stained with DAPI in blue. The magnified regions of the boxed regions (D′,E′) highlight different zones of joint chondrocytes and are shown without the DAPI channel. The section in (F) is above the jaw joint sections of (D,E). (H,I) RNAscope in situ hybridization for grem1a and coch at the articular surface of uninjured (H) and 21 dplt (I) jaw joints. Nuclei stained with DAPI in blue. (J) Model of chondrocyte zones (blue, purple, and green), joint-adjacent periosteum (red), and interopercular–mandibular ligament (yellow) with marker genes in the adult jaw joint. Scale bars = 50 μm (D–H) and 10 μm (D′,E′). |

