
Figure 6
- ID
- ZDB-FIG-220131-57
- Publication
- Brombin et al., 2022 - Tfap2b specifies an embryonic melanocyte stem cell that retains adult multifate potential
- Other Figures
- All Figure Page
- Back to All Figure Page
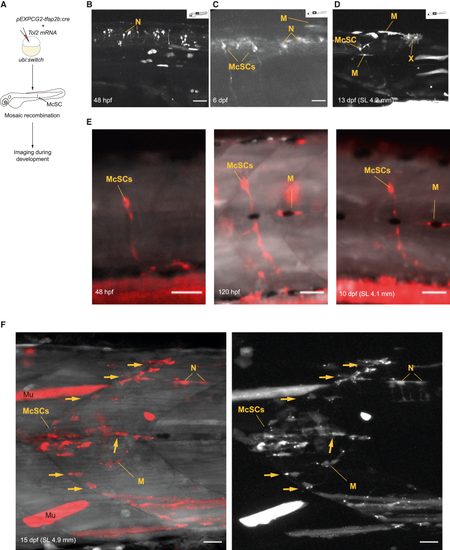
Individual tfap2b+ McSCs during development and at the onset of metamorphosis (A) Experimental protocol overview for tfap2b+ mosaic lineage tracing. pEXP-GC2Tol2-tfap2b:cre and Tol2 mRNAs were injected into ubi:switch embryos at the zygote stage and imaged at different stages to identify mCherry+ McSCs and progenitors. (B–D) tfap2b lineage tracing during zebrafish development at (B) 48 hpf, (C) 6 dpf, and (D) 13 dpf (standard length [SL], 4.2 mm). Shown are representative images of 7–8 animals imaged per stage (1 technical replicate). White pseudocoloring is used for mCherry. Maximum intensity (MAX) projection. Scale bars, 50 μm. (E) Example of a single McSC followed through development of a single fish and imaged at 48 hpf (left), 120 hpf (center), and 10 dpf (SL, 4.1 mm; right). The McSC produces progenitors that populate the ventrally located axonal projection and a lateral line-associated melanocyte. The embryo was injected with 1.5 pg/nL of tfap2b:cre. Scale bars, 50 μm. (F) Dramatic expansion of progenitors from the McSCs at the onset of the metamorphosis. Shown is a confocal imaging of a clone expanding from a single McSC at 15 dpf (SL, 4.9 mm). Arrows indicate axon-associated cells. White pseudocoloring is used for the GFP channel and red for the mCherry channel in the left panel, and white pseudocoloring is used for the mCherry channel in the right panel. The embryo was injected with 1.5 pg/nL of tfap2b:cre. Scale bars, 20 μm. I, iridophore, M, melanocyte; Mu, muscle (off-target signal); McSC, melanocyte stem cell; N, NT/spinal cord neuron; X, xanthophore. See also Figure S5. |