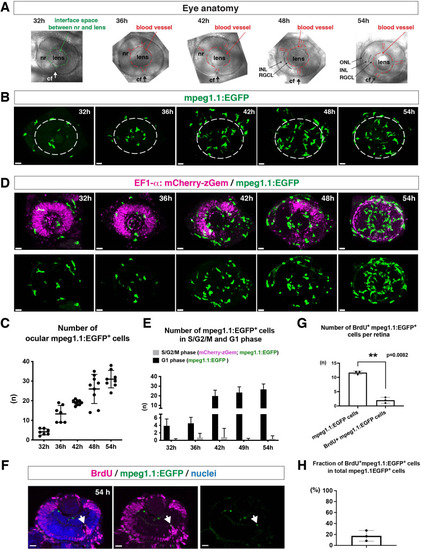
Figure 1
- ID
- ZDB-FIG-211216-202
- Publication
- Ranawat et al., 2021 - Mechanisms underlying microglial colonization of developing neural retina in zebrafish
- Other Figures
- All Figure Page
- Back to All Figure Page
|
(A) Lateral view of zebrafish eyes used for confocal scanning shown in panel (B). Anterior is left and dorsal is up. The choroid fissure (cf, arrows) is formed at the ventral retina. At 32 hpf, the interface space between the neural retina (nr) and lens appears, in which ocular blood vessels are formed after 36 hpf. At 48 hpf, RGCL and INL are distinct. At 54 hpf, the ONL becomes evident. (B) Three-dimensional confocal images of mpeg1.1:EGFP-positive microglial precursors (green) in the retina from 32 to 54 hpf. Dotted circles indicate the outline of the optic cup. The first microglial precursors appear in the choroid fissure and near the lens at 32 hpf. Microglial precursors in the optic cup progressively increase in number. At 42 hpf, they start to enter retinal tissue and spread into the entire neural retina by 54 hpf. Scale: 30 µm. (C) Histogram of the number of intraocular microglial precursors from 32 to 54 hpf. Horizonal and vertical bars indicate means ± SD. (D) Three-dimensional confocal images of Tg[EF1α:mCherry-zGem; mpeg1.1:EGFP] retinas from 32 to 54 hpf. Tg[EF1α:mCherry-zGem] (magenta) indicates cells undergoing S and G2 phases. mpeg1.1:EGFP-positive microglial precursors (green) are mostly negative for mCherry-zGem, suggesting that most ocular microglial precursors are in G1 phase. Scale: 30µm. (E) Histogram of numbers of intraocular microglial precursors expressing only mpeg1.1:EGFP, and microglial precursors expressing both mCherry-zGem and mpeg1.1:EGFP in retinas from 32 to 54 hpf. Double-positive microglial precursors represent proliferating microglial precursors undergoing S/G2 phase. Single mpeg1.1:EGFP-positive microglial precursors represent microglial precursors in G1 phase. Bars and lines indicate means ± SD. (F) Sections of Tg[mpeg1.1:EGFP] transgenic retinas with BrdU incorporated and labeled with anti-BrdU (magenta) and anti-EGFP (green) antibody. Nuclei were counterstained by TOPRO3 (blue). The arrowhead indicates BrdU- and mpeg1.1:EGFP double-positive cells. Most mpeg1.1:EGFP+ cells are BrdU-negative at 54 hpf, suggesting that they are not proliferative. Scale: 20 µm. (G) Histogram of numbers of mpeg1.1:EGFP+ cells and BrdU-positive mpeg1.1:EGFP+ cells per retinal section. Bars and lines indicate means ± SD. **p < 0.01. (H) Fraction of BrdU-positive proliferative mpeg1.1:EGFP+ cells in total mpeg1.1:EGFP+ cells. The average is less than 20%, indicating that more than 80 % of ocular microglial precursors are in the G1 phase. Bars and lines indicate means ± SD.
|

