Figure 2
- ID
- ZDB-FIG-211201-193
- Publication
- Raby et al., 2021 - Loss of Polycomb Repressive Complex 2 Function Alters Digestive Organ Homeostasis and Neuronal Differentiation in Zebrafish
- Other Figures
- All Figure Page
- Back to All Figure Page
|
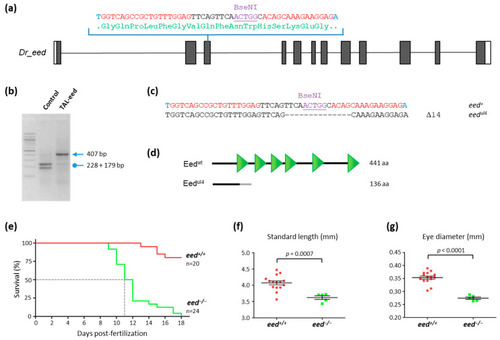
Loss of eed gene function leads to zebrafish death at around 10–12 dpf: (a) schematic representation of the genomic structure of the eed gene, with coding and untranslated sequences depicted as solid and open boxes, respectively. The sequence targeted by the TALEN in exon 3 is indicated with left and right TALEN binding sites shown in red, while the BseNI restriction sequence is underlined; (b) identification of mutant embryos using restriction fragment length polymorphism. Genomic DNA was prepared from an uninjected (Control) and an eed TALEN injected (TAL-eed) embryo, amplified by PCR and subjected to BseNI digestion. The TAL-eed injected embryo contains undigested material (arrow at 407 bp), indicating that the BseNI diagnostic restriction site has been disrupted; (c) sequence of the mutant allele compared to its wild-type counterpart. Dashes show deleted nucleotides. The mutated eedul4 allele possesses a deletion of 14 nucleotides; (d) schematic representation of wild-type (Eedwt) and predicted mutant (Eedul4) proteins. The gray line in the predicted mutant protein corresponds to residues read out of frame prior to encountering a premature STOP codon. The green triangles in the wild-type protein show the WD40 domains; (e) Kaplan–Meier survival curves over 18 days for eed+/+ (red curve) and eed−/− (green curve) siblings from a cross between heterozygous eed+/− fish. The number of fish considered is indicated; (f) measurement of the total length of eed+/+ (red) and eed−/− (green) siblings from a cross between heterozygous eed+/− fish at 11 dpf. Statistical significance was assessed using a t-test; (g) measurement of the eye diameter of eed+/+ (red) and eed−/− (green) siblings from a cross between heterozygous eed+/− fish at 11 dpf. Statistical significance was assessed using a Student t-test. |
| Fish: | |
|---|---|
| Observed In: | |
| Stage Range: | Days 7-13 to Days 14-20 |

