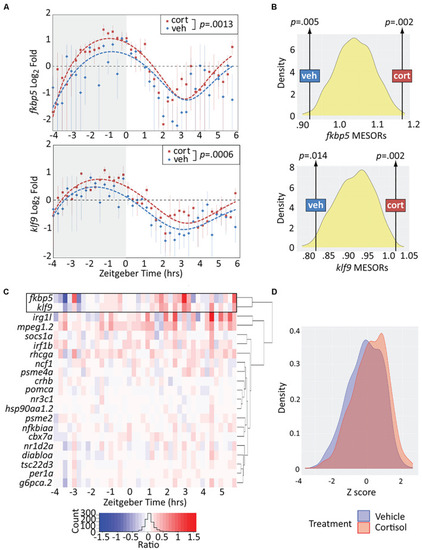
Chronic cortisol treatment similarly upregulates klf9 and fkbp5. (A) Sinusoid models fit to fkbp5 (top) and klf9 (bottom) qPCR relative expression data. Each data point represents the average of three biological replicates of pooled larvae (3–6 larvae per pooled sample; VEH-treated datapoints are the same as in Figure 1). P-values calculated using paired t-test (data paired at each timepoint). Fit of the model to the data was tested by ANOVA (P < 0.0001 in each case, see Supplementary Figure 2). (B) Distributions of Midline Estimated Statistics Of Rhythmicity (MESORs, a rhythm-adjusted mean) of datasets generated by randomly selecting expression data from VEH or CORT samples at each timepoint in experiments shown in panel (A). MESORs of VEH and CORT datasets sit at either extreme. (C) Heat map of the expression ratio in CORT/VEH samples (log2 transformed) of klf9, fkbp5, and other targets of glucocorticoid (GC) signaling in our Nanostring data set. (D) Density plot of Z-scored expression of all genes measured with Nanostring indicates an overall increase in expression due to chronic CORT treatment.
|

