
Figure 3
- ID
- ZDB-FIG-211029-274
- Publication
- Chiang et al., 2021 - Progranulin A Promotes Compensatory Hepatocyte Proliferation via HGF/c-Met Signaling after Partial Hepatectomy in Zebrafish
- Other Figures
- All Figure Page
- Back to All Figure Page
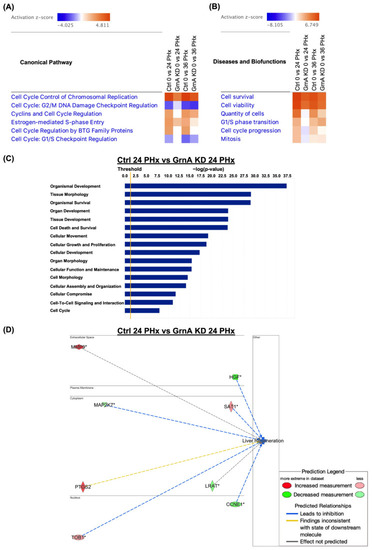
Canonical pathway, and functional and gene interaction network analyses of control and GrnA Mo-treated animals at 0, 24, and 36 h after PHx. (A) Heatmap shows canonical pathway analysis in comparison to control and GrnA Mo treatments at 24 and 36 h after PHx versus 0 h after PHx. (B) The heatmap shows disease and biofunctional analyses of control and GrnA Mo treatment at 24 and 36 h after PHx versus 0 h after PHx. Activation z-score indicates activation states of upstream transcriptional regulators: “activated” (orange) or “inhibited” (blue). Significantly activated or inhibited indicates an overlap p-value ≤ 0.05 and an z-score ≥ 1.5 (or ≤−1.5). (C) The top ranked diseases and biofunctions in control Mo versus GrnA Mo treatment at 24 h PHx. The threshold line represents a p-value of 0.05. (D) The gene interaction network was predicted for liver regeneration. The lines represent direct or indirect gene-to-gene interactions, and the color represents fold change. The pathway, functional analyses, and network analyses were generated using IPA. * more than one ID linked to this gene. |