|
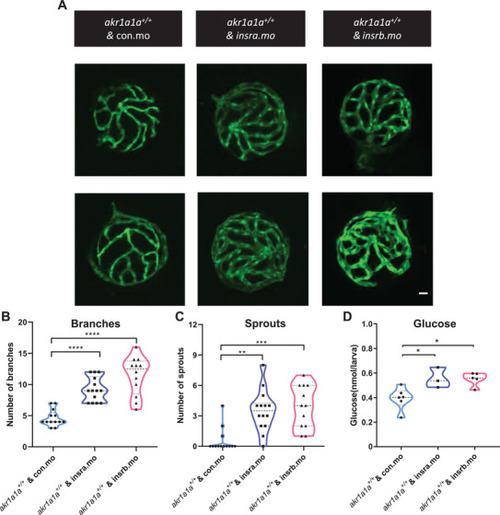
insra/insrb expression silencing induced vascular alterations and caused higher glucose level at 5 dpf. A) Representative confocal images of hyaloid vasculature. White scale bar: 20 µm. B,C) Quantification of hyaloid vasculature showed significant increasing numbers of branches and sprouts in larvae upon insra/insrb silencing at 5 dpf. n = 12–14. D) Whole‐body glucose measurement showed higher glucose level in akr1a1a1+/+ larvae upon insra/insrb silencing at 5 dpf. n = 3–6 clutches with 20 larvae. For statistical analysis one‐way ANOVA followed by Tukey's multiple comparisons test was applied. *p < 0.05, **p < 0.01, ***p < 0.001, ****p < 0.0001.
|