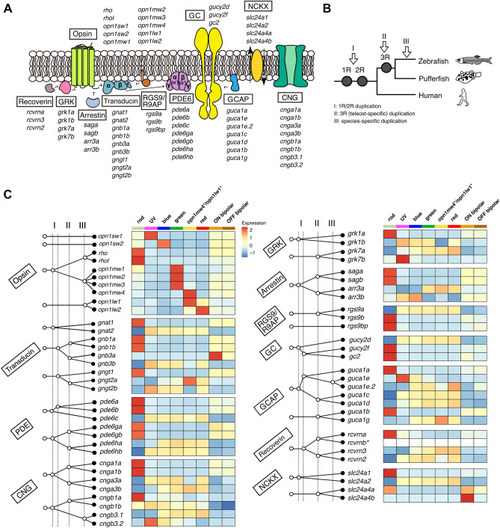
Expression partitioning of paralogous phototransduction genes. (A) Schematic representation of vertebrate phototransduction cascade components. During phototransduction, light-activated opsin induces the detachment of the catalytic subunit Gα of the heterotrimeric G protein (transducin) from the inhibitory β/γ subunits. The activated Gα subunit then binds to the two inhibitory γ subunits of cGMP phosphodiesterase 6 (PDE6), thereby relieving inhibition on the catalytic subunits (α, β, and α′). The activated PDE subunits, in turn, catalyze the hydrolysis of the second messenger cGMP, leading to closure of cGMP-gated channels (CNG) on the plasma membrane and photoreceptor membrane hyperpolarization. Shut-off of the activated transducin is accelerated by a GTPase-activating protein complex (RGS9 and R9AP). The light-activated opsin is quenched via phosphorylation mediated by visual pigment kinases (GRK) and by the subsequent binding of arrestins. The activity of GRKs is regulated by binding of recoverin in a calcium-dependent manner. In the recovery/adaptation process, guanylyl cyclase activating protein (GCAP) enhances the synthesis of the second messenger cGMP through guanylyl cyclase (GC) in a calcium-dependent manner. Na+/Ca2+, K+ exchanger (NCKX) is involved in maintaining the dynamic equilibrium of calcium ions in the outer segment. In cones, the ion channel (CNG) and exchanger (NCKX) are located in the plasma membrane, whereas in rods they are located in the disc membrane. Figure design is adapted from Larhammar et al., 200980. (B) Phylogenetic tree showing the approximate time points at which various genome duplications occurred. (C) Evolutionary scenario for gene duplications of vertebrate phototransduction cascade genes (Left panels) and heatmap showing their expression levels in each cell population (Right panels). Left: The four dotted vertical lines mark the events, ‘1R’, ‘2R’, ‘II’, ‘III’, described in (B). The horizontal axis is not to scale. White circles indicate putative ancestral genes. Black circles indicate genes encoded in the zebrafish genome. Evolutionary branching patterns for each gene family are described according to the described previous studies8,45,47,48 and our BLAST searching results. Figure design is adapted from Lamb, 20208. Right: heatmap showing average expression levels of phototransduction genes in each cluster. Values are row-wise Z-scored gene-expression values. rcvrnb expression is not detected.
|

