FIGURE

Figure 2

ID
ZDB-FIG-210714-42
Publication
Jamalpoor et al., 2021 - Cysteamine-bicalutamide combination therapy corrects proximal tubule phenotype in cystinosis
Other Figures
All Figure Page
Back to All Figure Page
Figure 2

Metabolomic and proteomic profiling reveal αKG accumulation in cystinosis

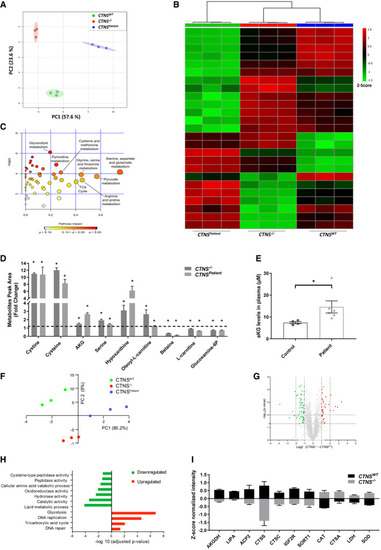
Principal component analysis (PCA) of control (CTNSWT), CRISPR‐generated cystinotic (CTNS−/−) and patient‐derived cystinotic (CTNSPatient) cells based on the metabolites measured. Each dot represents one sample, and the dots of the same colour are biological replicates (n = 3).

Heat map analysis of top 25 metabolites distinctively expressed in control and CTNS−/− cells. Metabolites significantly decreased (P < 0.05) were displayed in green, while metabolites significantly increased (P < 0.05) were displayed in red (n = 3).

Global test pathway enrichment analysis of the intracellular metabolic interactions distinctively affected in CTNS−/− cells compared to healthy control cells (n = 3). Larger circles further from the y‐axis and orange‐red colour show higher impact of pathway.

List of metabolites that were shared and significantly altered in both the CTNS−/− and CTNSPatient cells compared to control cells (n = 6).

Plasma levels of αKG (µM) in healthy individuals (n = 4) and cystinotic patients (n = 6). All cystinotic patients were on cysteamine treatment at the time of blood sampling. For this experiment, non‐parametric Mann–Whitney t‐test was used to demonstrate the significance.

Principal component analysis (PCA) of the measured proteins in CTNSWT, CTNS−/− and CTNSPatient (n = 3).

Volcano plot illustrates differentially abundant proteins (n = 3). The ‐log10 (Benjamini–Hochberg corrected P‐value) is plotted against the log2 (fold change: CTNSWT/CTNS−/−).

Gene ontology (GO) analysis illustrates classes of proteins differing between CTNSWT and CTNS−/− cells (n = 3).

List of proteins that were significantly upregulated and downregulated in CTNS−/− cells compared to control cells (n = 3). AKGDH; Alpha‐ketoglutarate dehydrogenase, LIPA; Lysosomal acid lipase, ACP2; Lysosomal acid phosphatase, CTSS; Cathepsin S, CTSC; Dipeptidyl peptidase, IGF2R; Cation‐independent mannose‐6‐phosphate receptor, SORT1; Sortilin, CAT; Catalase, CTSA; Lysosomal protective protein and SOD; Superoxide dismutase.

Data information: Data are expressed as mean ± SEM. *P‐values < 0.05 were considered to be significant. One‐way ANOVA with Dunnett’s correction (A, B, C, D, E, F, G, H and I). Exact P‐values and statistical tests are listed in Appendix Table S1.

Expression Data

Expression Detail
Antibody Labeling
Phenotype Data

Phenotype Detail
Acknowledgments
This image is the copyrighted work of the attributed author or publisher, and ZFIN has permission only to display this image to its users. Additional permissions should be obtained from the applicable author or publisher of the image. Full text @ EMBO Mol. Med.