
Fig. 7
- ID
- ZDB-FIG-210712-38
- Publication
- Ding et al., 2021 - Metabolomic and transcriptomic profiling of adult mice and larval zebrafish leptin mutants reveal a common pattern of changes in metabolites and signaling pathways
- Other Figures
- All Figure Page
- Back to All Figure Page
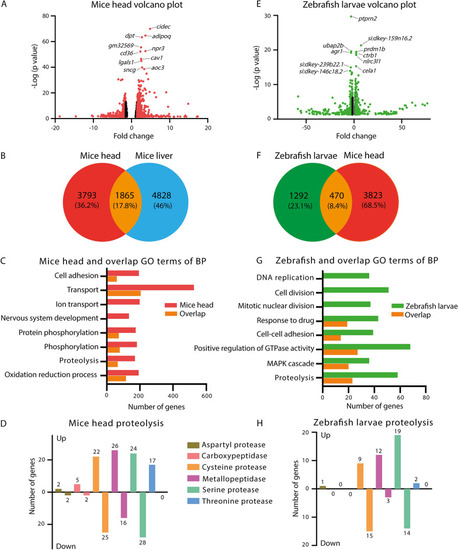
Transcriptome signature sets of mice and zebrafish larvae. A A Volcano plot showing a graphical representation of the significance (p < 0.05) in ob/ob mice head compared to C57BL/6 mice head. The transcripts with fold change over 1.5 are highlighted in red. Fifteen significant genes in mice head out of the fold change in X axis are excluded to make the graph look well. B A Venn diagram showing the comparison of the number of significantly changed genes between ob/ob mice head and mice liver published by Kokaji et al. C The top eight GO terms of biological process (BP) with lowest p adjusted values and highest numbers of genes representatives in mice head and the overlap of B. GO gene ontology. D Number of genes in classification of GO term proteolysis in the signature set of mice head. E A Volcano plot showing a graphical representation of the significance (p < 0.05) in lepb mutant zebrafish larvae compared to wild type siblings. The transcripts with fold change over 1.5 are highlighted in green. Twenty-two significant genes in zebrafish larvae out of the fold change in X axis are excluded to make the graph look well. F A Venn diagram showing the comparison of the number of significantly changed genes from human homologs of the signature gene sets of zebrafish larvae and ob/ob mice head. G The top eight GO terms of BP with lowest p adjusted values and highest numbers of genes representatives in zebrafish larvae and the overlap of F. H Number of genes in classification of GO term proteolysis in the signature set of zebrafish larvae |