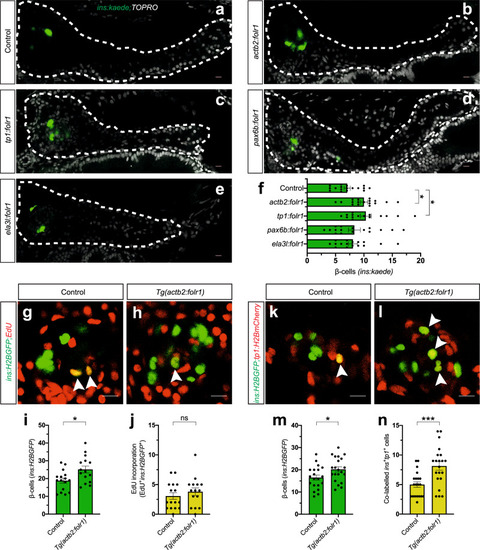
a–f Single-plane confocal pictures of pancreata in control (a), actb2:folr1 (b), tp1:folr1 (c), pax6b:folr1 (d), and ela3l:folr1 (e) larvae on the Tg(ins:kaede);Tg(ins:CFP-NTR) background, following two days of β-cell regeneration. TOPRO was used to counterstain nuclei, and the whole pancreas is outlined with a white dashed line. Quantification of the pancreatic β-cells showed that actb2:folr1 and tp1:folr1 overexpression had comparable increases in the β-cell regeneration assay (f). Scale bar, 10 μm. n = 17 (control), n = 17 (actb2:folr1), n = 15 (tp1:folr1), n = 16 (pax6b:folr1), and n = 16 (ela3l:folr1) biologically independent zebrafish larvae used for the quantification of β-cells. Data are presented as mean values ± SEM. One-way ANOVA was performed followed by Dunnett’s multiple comparison tests. f *P = 0.0348 (control vs. actb2:folr1), *P = 0.0202 (control vs tp1:folr1). g–j Single-plane confocal images of islets in control (g) and Tg(actb2:folr1) (h) larvae on the Tg(ins:H2BGFP);Tg(ins:flag-NTR) background following two days of β-cell regeneration while incubated with EdU to label proliferating cells. Quantification showed an increase in β-cell regeneration in the Tg(actb2:folr1) line (i), but no change in the number of β-cells incorporating EdU was observed (j). Arrowheads point to EdU+ins:H2BGFP+ cells. Scale bar, 10 μm. n = 16 control and n = 15 Tg(actb2:folr1) biologically independent zebrafish larvae were used for the quantification of this experiment. Data are presented as mean values ± SEM. Unpaired two-tailed Student’s t test was used to assess significance. i *P = 0.0122, j nonsignificant (ns), P = 0.3943. k–n Single-plane confocal images of islets in control (k) and Tg(actb2:folr1) (l) larvae on the Tg(ins:H2BGFP);Tg(ins:flag-NTR);Tg(tp1:H2BmCherry) background, used to lineage trace the ductal cells of the pancreas, after β-cell ablation. Quantification showed an increase in the number of regenerating β-cells (m) colabeled with the ductal cell marker tp1:H2BmCherry (n). Arrowheads point to tp1:H2BmCherry+ins:H2BGFP+ cells. Data for m, n were pooled from two independent experiments. Scale bar, 10 μm. n = 20 control and n = 21 Tg(actb2:folr1) biologically independent zebrafish larvae were used for the quantification of samples pooled from two independent experiments. Data are presented as mean values ± SEM. Unpaired two-tailed Student’s t test was used to assess significance for (m) *P = 0.0306. The Mann–Whitney two-tailed test was used for (n) ***P = 0.0010.
|

