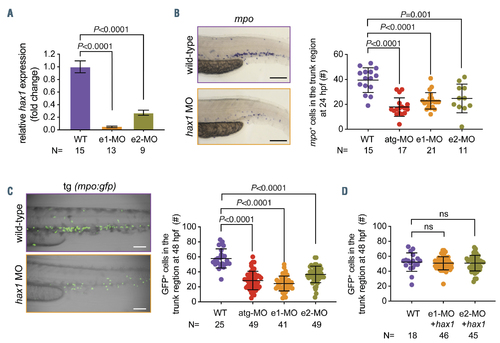
Knockdown of hax1 impairs neutrophil development. (A) Relative change of wild-type hax1 transcript in the hax1 morphants compared with wild-type (WT) using quantitative polymerase chain reaction. N indicates number of biological replicates. (B) Representative images of mpo-stained cells in WT and e1-MO injected embryos (left panel). Note that each stained cell represents a neutrophil. The right panel shows numbers of mpo stained cells in the trunk region at 24 hours postfertilization (hpf). (C) Injection of hax1 morpholinos (MO) in the tg(mpo:gfp) line. The left panel shows representative images of uninjected (WT) and hax1 e1-MO injected transgenic embryos at 48 hpf. The right panel shows numbers of green fluorescent protein-positive cells in the trunk region. (D) Co-injection of e1-MO or e2- MO morpholinos with hax1 mRNA rescued the reduced neutrophil numbers in the tg(mpo:gfp) line. Scale bars indicate 100 mm. Each dot represents an individual embryo. Data are means } standard deviation.
|
