
Fig. 4
- ID
- ZDB-FIG-210426-19
- Publication
- Bieczynski et al., 2020 - Chemical effects on dye efflux activity in live zebrafish embryos and on zebrafish Abcb4 ATPase activity
- Other Figures
- All Figure Page
- Back to All Figure Page
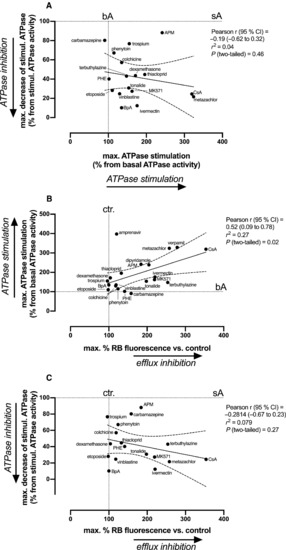
(A–C) Correlations of the maximum measured effect levels for each compound in the different tests: (A) maximum inhibition of stimulated Abcb4 ATPase activity vs. the maximum stimulation of the basal Abcb4 ATPase activity; (B) maximum stimulation of the basal Abcb4 ATPase activity vs. the maximum observed increase in fluorescence in the dye efflux assay; and (C) maximum inhibition of stimulated Abcb4 ATPase activity vs. the maximum observed increase in fluorescence in the dye efflux assay. Each compound is represented by a data point. Pearson’s correlation parameters are shown in the respective graphs. Linear regressions are with 95% confidence intervals. APM, azinphos‐methyl; bA, basal ATPase activity; BpA, bisphenol A; CsA, cyclosporin A; ctrl, control; PHE, phenanthrene; sA, stimulated ATPase activity. Equations for linear regressions are as follows: (a) y = −0.06692x + 53.66; (b) y = 0.6272x + 82.25; and (c) y = 0.09262x + 58.07. |