
Fig. 4
- ID
- ZDB-FIG-210422-46
- Publication
- Xie et al., 2021 - Altered Visual Function in a Larval Zebrafish Knockout of Neurodevelopmental Risk Gene pdzk1
- Other Figures
- All Figure Page
- Back to All Figure Page
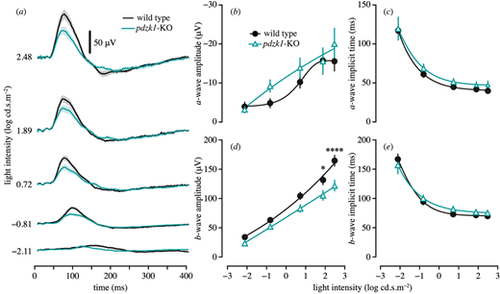
Scotopic ERGs of wild-type and pdzk1-KO larvae. (a) Group average ERG traces. Wild-type and pdzk1-KO larvae responses are shown as black and cyan lines, respectively, at −2.11, −0.81, 0.72, 1.89, and 2.48 log cd·s·m−2. Scale bar: 50 µV. The light bands around group average traces represent ±1 SEM. Note that the a-wave is not visible in the group averages owing to variability in the implicit time, which causes the individual traces to cancel out. Remaining panels show group average (±SEM) (b) a-wave amplitude, (c) a-wave implicit time, (d) b-wave amplitude, and (e) b-wave implicit time for wild-type (black circles) and pdzk1-KO (cyan triangles) larvae. Lines were fit using a four-parameter sigmoidal function. Data were compared using two-way ANOVA with Bonferroni correction. *P < 0.05; ****P < 0.0001. |