
Fig. 5
- ID
- ZDB-FIG-210324-5
- Publication
- Ye et al., 2020 - Enteroendocrine cells sense bacterial tryptophan catabolites to activate enteric and vagal neuronal pathways
- Other Figures
- (all 7)
- All Figure Page
- Back to All Figure Page
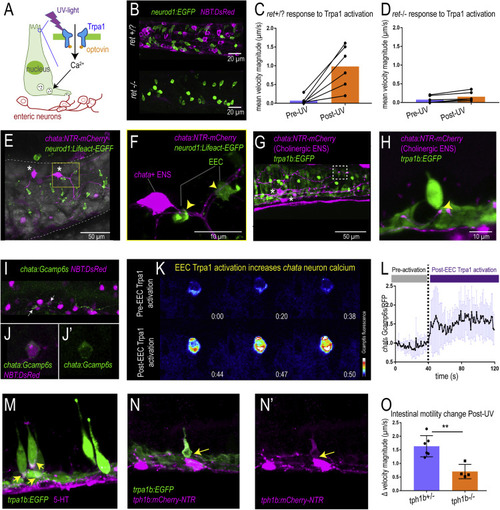
Figure 5. Activation of EEC Trpa1 signaling activates enteric cholinergic neurons and promotes intestinal motility through 5-HT (A) Working model showing Trpa1 stimulation in EECs activates enteric neurons. (B) Confocal image of ret+/? (ret+/+ or ret+/−) and ret−/− zebrafish intestine. neurod1 labeled EECs shown in green and NBT labeled ENS shown in magenta. (C) Quantification of mean intestinal velocity magnitude before and after EEC Trpa1 activation in ret+/? zebrafish. (D) Quantification of mean intestinal velocity magnitude before and after UV activation in ret−/− zebrafish. (E) Confocal image showing EECs (neurod1+; green) and cholinergic enteric neurons (chata+; magenta) in the zebrafish intestine. Asterisks indicate cholinergic enteric neuron cell bodies, which reside on the intestinal wall. (F) Higher magnification view indicates the EECs (green) directly contact nerve fibers that are extended from the chata+ enteric neuron cell body (magenta) as indicated by yellow arrows. (G and H) Confocal image showing Trpa1+EECs (green) form direct contact with chata+ enteric neurons (magenta). (I and J) In vivo calcium imaging of cholinergic enteric neurons. All the enteric neurons are labeled as magenta by NBT:DsRed. Yellow arrow indicates a chata+ enteric neuron that expresses Gcamp6s. (K) In vivo calcium imaging of chata+ enteric neuron before and after EEC Trpa1 activation. (L) Quantification of chata+ enteric neuron Gcamp6s fluorescence intensity before and after EEC Trpa1 activation. (M) Confocal image of TgBAC(trpa1b:EGFP) zebrafish intestine stained for 5-HT. Yellow arrows indicate the presence of 5-HT in the basal area of trpa1b+ EECs. (N) Confocal image showing zebrafish Trpa1b+ EECs (green) express Tph1b (magenta). (O) Quantification of intestinal motility changes in response to EEC Trpa1 activation in tph1b+/− and tph1b−/− zebrafish. Student’s t test was used in (O). ∗∗p < 0.01 |