|
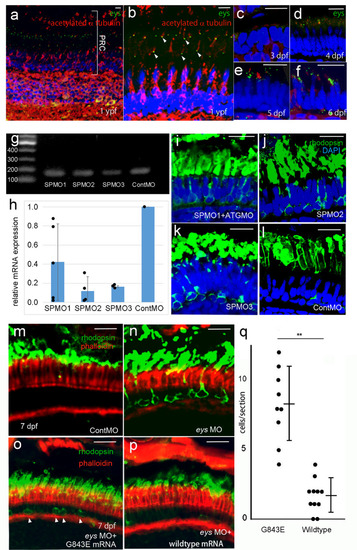
Functional assessment of <italic>EYS</italic> G843E variant following morpholino-mediated knockdown of <italic>eys</italic> in zebrafish.a Immunostaining of Eys (green) in zebrafish retina at 1-year post-fertilization (ypf). b High-magnification image of photoreceptors. Eys (arrowhead, green) localized at the basal side of connecting cilium (acetylated α tubulin, red) of the photoreceptors. c–f Expression of Eys during development at 3 days post- post-fertilization (pdf), 4, 5, and 6 dpf. g RT-PCR of eys at 4 dpf (45 cycles) following injection of three different MOs. h Quantitative RT-PCR analyses of the morphants (biologically independent samples). SP1MO (N = 5), SP2MO (N = 3), and SP3MO (N = 3). Eys expression was reduced by at least 50% at 4 dpf. Vertical bar: mean ± standard deviation. i–l Basal intracellular deposition of rhodopsin (rhodopsin mislocalization) observed following injection of three different MO at 6 dpf. Note, injections of three different MOs resulted in the same phenotype. m, n Rhodopsin localization in the photoreceptors at 7 dpf. m Rhodopsin is correctly localized at the photoreceptor outer segments in the control. neys knockdown by MO-induced rhodopsin mislocalization toward the basal and the lateral membrane of the photoreceptors (N = 6 biologically independent fishes). o, p Greater improvement of the rhodopsin mislocalization was achieved in the eyes supplemented with wild-type human EYS mRNA (p) over those injected with mutant human EYS mRNA with G843E (o) after SPMO2-mediated knockdown of eys, consistent with decreased EYS function by the mutation. q A quantitative analysis of o (N = 9 biologically independent fishes) and p (N = 9 biologically independent fishes). Numbers of cells with mislocalized rhodopsin per retinal section were counted (vertical bar: mean ± standard deviation). The difference is significant (P = 0.00903; Wilcoxon rank-sum test) **P < 0.01. PRC photoreceptors, Cont control. Scale bar = 10 µm (a–e, i–p).
|

