
Figure 3.
- ID
- ZDB-FIG-201223-56
- Publication
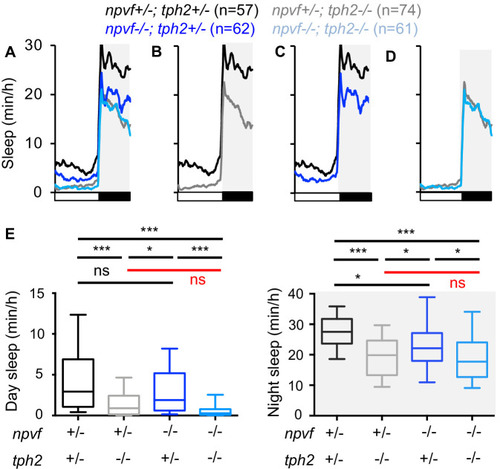
- Lee et al., 2020 - Neuropeptide VF neurons promote sleep via the serotonergic raphe
- Other Figures
- All Figure Page
- Back to All Figure Page
( |