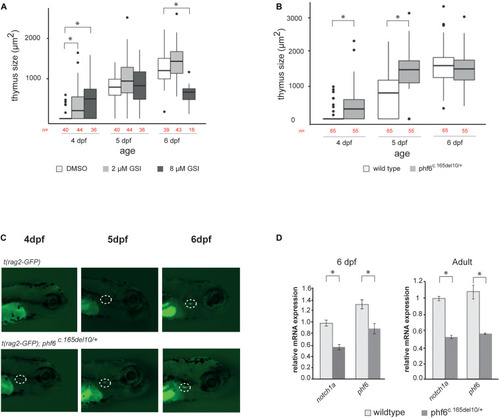
phf6 downregulation accelerates T cell development in vivo. (A) Box plot showing thymus size (μm2) at 4, 5, and 6 days post-fertilization (dpf) based on GFP signal of wild type (AB) fish treated with 2 or 8 μM of gamma-secretase inhibitor (GSI) or DSMO as control treatment. Details on these results are provided in Supplementary Table 2 and statistical analysis is shown in Supplementary Table 3, ∗P < 0.05 (Wilcoxon rank sum test). (B) Boxplot showing thymus size (μm2) of wild type (AB) and phf6c.165del10/+ heterozygous embryos from 4 until 6 dpf based on rag2-GFP signal quantification. ∗P < 0.05 (Wilcoxon rank sum test, Supplementary Table 4). (C) Representative image of thymus visualization used for quantification of data as shown in panel (A). Original magnification X30. Circle with white dashed line indicates emerging thymus. (D) Average normalized notch1a and phf6 expression in sorted T cells of 4 replicates of 100 pooled wild type (AB) and phf6c.165del10/ + embryo’s on 6dp (left) and of 3 replicates of 6 pooled wildtype and 6 pooled phf6c.165del10/ + adult zebrafish (right). Error bars indicate SEM, ∗P < 0.05 (unpaired T-test).
|
