|
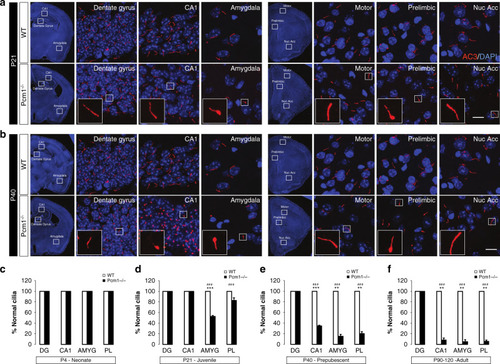
Temporal and spatial ciliary abnormalities at different ages.a Coronal brain images revealing bulbous cilia in the prelimbic cortex and amygdala of P21 Pcm1−/− mice. Scale 5 µm (b) At P40, brain regions in the Pcm1−/− mice showing an increased frequency of bulbous cilia. Scale 5 µm (c–f) Bar graphs showing the proportion of normal cilia in various brain regions from P4 (c), P21 (d), P40 (e), and P90 (f) in WT and Pcm1−/− mice (c–f; N > 30 cilia/region/mouse, 3 mice/genotype; t-test p < 0.001 P21 AMYG; p < 0.001 P21 CA1; p = 0.004 P40 AMYG; p = 0.005 P40 PL; p = 0.004 P90 CA1; p = 0.003 P90 AMYG; p = 0.0012 P90 PL). DG dentate gyrus, AMY amygdala, PL prelimbic cortex. χ2 test, ###p < 0.001; t-tests, mean ± SEM **p < 0.01, ***p < 0.001, WT vs. Pcm1−/−. Source data and detailed statistical information are provided as a Source Data File.
|