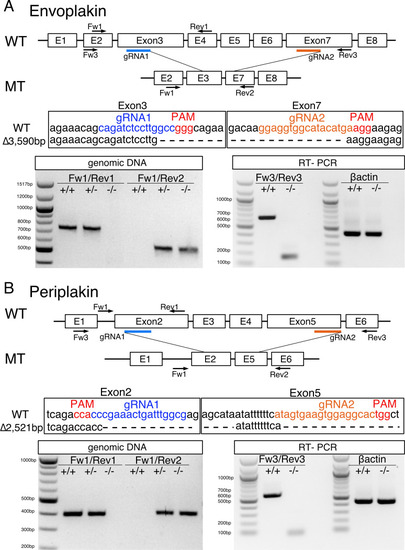
Figure 4—figure supplement 1.

<italic>evpl</italic> and <italic>ppl</italic> mutants.

(A) The evpl gene targeting strategy. Sequence shows the deletion site. Bottom-left panel shows PCR analysis of genomic DNA isolated from adult fish fins with the indicated genotypes. Primers Fw1 and Rev1 were used to detect WT alleles (743 bp) and primers Fw1 and Rev2 were used to detect mutant alleles (576 bp). Bottom-right shows RT-PCR of RNA isolated from adult fish scales with the indicated genotypes. Primers Fw3 and Rev3 were used to detect WT (638 bp) and mutant (167 bp) alleles. (B) The ppl gene targeting strategy. Sequence shows the deletion site. Bottom-left panel shows PCR analysis of genomic DNA isolated from adult fish fins with the indicated genotypes. Primers Fw1 and Rev1 were used to detect the WT (404 bp) allele and primers Fw1 and Rev2 were used to detect the mutant allele (468 bp). Bottom-right shows RT-PCR of RNA isolated from adult fish scales with the indicated genotypes. Primers Fw3 and Rev3 were used to detect WT (571 bp) and mutant (107 bp) alleles.

Expression Data

Expression Detail
Antibody Labeling
Phenotype Data

Phenotype Detail
Acknowledgments
This image is the copyrighted work of the attributed author or publisher, and ZFIN has permission only to display this image to its users. Additional permissions should be obtained from the applicable author or publisher of the image. Full text @ Elife