|
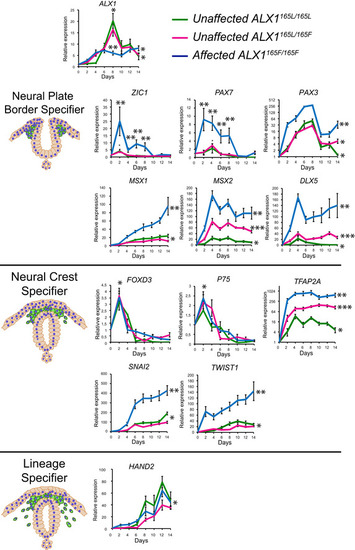
Timeline of key <styled-content toggle='no' style='fixed-case'>NCC</styled-content>‐associated genes during differentiationGene expression analysis across NCC differentiation of unaffected control ALX1165L/165L (green), heterozygous ALX1165L/165F (magenta), and homozygous ALX1165F/165FiPSC:ALX1, neural plate border specifier genes ZIC1, PAX7, PAX3, MSX1, MSX2, DLX5; neural crest specifier genes FOXD3, P75, TFAP2A, SNAI2, TWIST1; and lineage specifier gene HAND2. The RT–qPCR relative expression values were normalized to RPLP0 and GAPDH expression. Data are represented as pooled mean ± SEM of three experiments on three clones from each genotype. Exact P‐values are provided in Table EV1. Data from each clone were pooled, and the mathematical mean was calculated. SEM was used to determine the standard error. To test statistical significance, an ANOVA test was performed. A P‐value < 0.05 was considered to be statistically significant.
|