
Figure 7
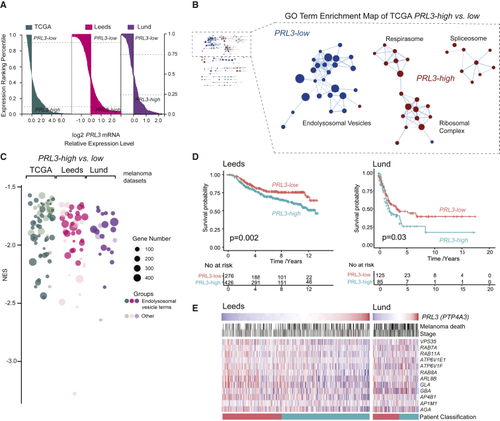
A (A) Patient samples ranked by (B) GO enrichment analysis (cellular compartment) of (C) Bubble plot of GO cellular components in (D) Kaplan Meier survival curves of (E) Heatmap of endolysosomal genes ranked by See also |
Reprinted from Developmental Cell, 54(3), Johansson, J.A., Marie, K.L., Lu, Y., Brombin, A., Santoriello, C., Zeng, Z., Zich, J., Gautier, P., von Kriegsheim, A., Brunsdon, H., Wheeler, A.P., Dreger, M., Houston, D.R., Dooley, C.M., Sims, A.H., Busch-Nentwich, E.M., Zon, L.I., Illingworth, R.S., Patton, E.E., PRL3-DDX21 Transcriptional Control of Endolysosomal Genes Restricts Melanocyte Stem Cell Differentiation, 317-332.e9, Copyright (2020) with permission from Elsevier. Full text @ Dev. Cell