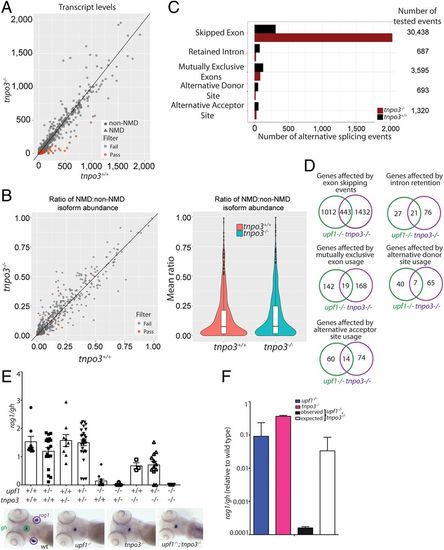
Characterization of the transcriptome of tnpo3 mutants at 5 dpf. (A) Differential transcript-level expression analysis of wild-type and mutant fish. Expression levels are depicted as TPM. (B) Minor effects on NMD ratios (Left); violin plot of NMD ratios (Right) (P = not significant). (C) Summary of differential splicing analysis. (D) Comparison of alternative splicing events between upf1 and tnpo3 mutants. The numbers of unique events are indicated for each class. (E) Synthetic interaction of upf1 and tnpo3 mutations. The thymopoietic capacities (expressed as rag1/gh ratios) of the nine genotypes resulting from an intercross of double heterozygous upf1+/−;tnpo3+/− parents are indicated. Each data point represents one fish; mean ± SEM. Representative WISH results for the key genotypes are shown (Lower). (Magnification: 10×.) (F) Comparison of phenotypes of the two single mutants (upf1−/− and tnpo3−/−, respectively), and the upf1−/−;tnpo3−/− double mutant; the latter phenotype is compared to the expected phenotype (multiplicative model). The thymopoietic capacity observed in the double mutant is significantly lower than expected from the combination of the single mutants, calculated under the assumption of no genetic interaction, indicative of synthetic genetic interaction.
|
