FIGURE

Figure 6

ID
ZDB-FIG-200814-29
Publication
Peperstraete et al., 2020 - Enhancement of Breast Cancer Cell Aggressiveness by lncRNA H19 and its Mir-675 Derivative: Insight into Shared and Different Actions
Other Figures
All Figure Page
Back to All Figure Page
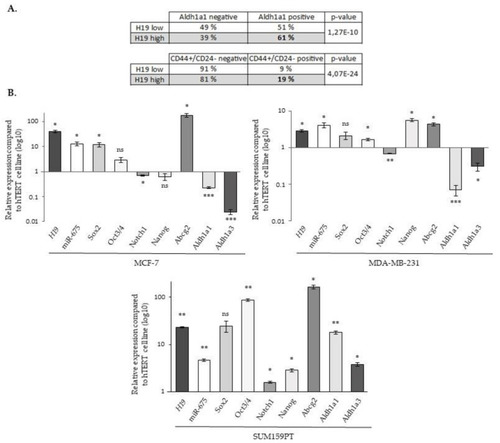
Figure 6

The expression of H19, miR-675 and different stem cell markers. (A) The expression of the H19 gene in mammary tumors expressing or not stem cell signatures. The table represents the H19 gene expression dependent on the gene signature of the tumors. Two gene signatures were used, one obtained in cell expressing ALDHA1 and the other in CD44+/CD24-. (B) The relative expression of H19, Sox2, Oct3/4, Notch1, Nanog, Abcg2, Aldh1a1 and Aldh1a3 genes and miR-675 in MCF-7, MDA-MB-231 and SUM159PT cells. The expression levels were related to the expression levels in hTERT cells indexed to 1. For panel A, a Fisher’s exact test was performed. * p < 0.05; ** p < 0.01; *** p < 0.001; ns: not significant.

Expression Data

Expression Detail
Antibody Labeling
Phenotype Data

Phenotype Detail
Acknowledgments
This image is the copyrighted work of the attributed author or publisher, and ZFIN has permission only to display this image to its users. Additional permissions should be obtained from the applicable author or publisher of the image. Full text @ Cancers