|
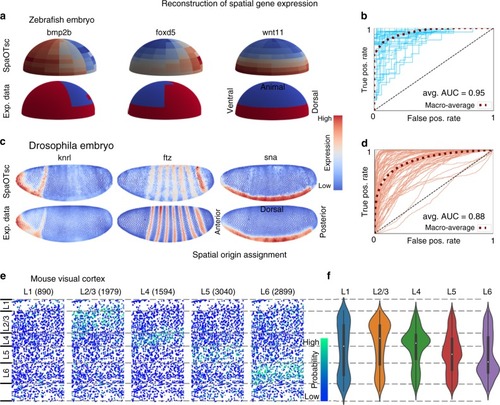
Validation of SpaOTsc using three systems.a Predicted spatial expressions for the zebrafish embryo (both data from ref. 13). b The receiver operating characteristics (ROC) curves of leave-one-out cross-validation (LOO CV) of the spatial expression prediction for the zebrafish embryo data. c Predicted spatial expressions for the Drosophila embryo (both data from ref. 10). d The ROC curves of LOO CV of the spatial expression prediction for the Drosophila embryo spatial data. e Assignment of spatial positions to the scRNA-seq data for the mouse visual cortex (spatial data from ref. 38; scRNA-seq data from ref. 37). Each column depicts all cells from the spatial data in the visual cortex. For example, in column one, the color of cells represents the average probability of the spatial origin of the 890 cells in scRNA-seq data labeled with spatial origin L1. f Violin plots along L1-L6 axis of the mapped spatial origins for single cells from each subregion. Inside the violin plots are standard boxplots (median, 25th perceltile, 75th percentile, the bigger of minimum value and 25th percentile – 1.5 interquartile range, and smaller of maximum value and 75th percentile + 1.5 interquartile range). The numbers of data points for the violin plots from left to right are 890, 1979, 1594, 3040, 2899, respectively.
|