|
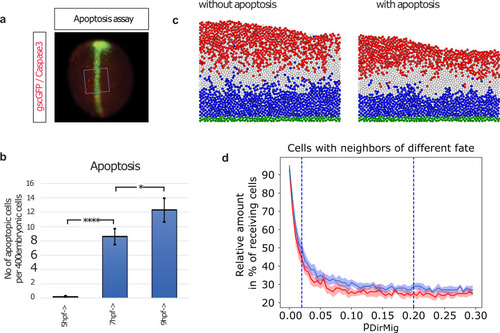
Apoptosis further improves neural plate patterning.To determine the number of apoptotic cells in the developing embryo, immunohistochemical staining against Caspase3 is performed at 5 hpf, 7 hpf, and 9 hpf. a), After antibody staining, 10 areas of ca 20 by 20 cells are placed randomly over the dorsal hemisphere of the embryos (marked by gsc-GFP expression) and within these squares of ca 400 cells, the number of apoptotic cells is counted. b) At 5 hpf, no apoptotic cells are detected. At 7 hpf 2% and at 9 hpf 3% apoptotic cells are observed. c) Induced apoptosis of a similar relative number of cells as experimentally determined are implemented into our simulations. The simulation of cytoneme based Wnt-transport with weak sorting and no induced apoptosis (left) is compared to the simulation with additionally enabled induced apoptosis (right) at t = tTRS = 180 min. Cell fates and coloring are as in Fig 1. d) Increasing the sorting parameter pDirMig during the directed transport simulations leads to decreased mixing of cell fates (red with, blue without apoptosis). Even large values for pDirMig, however, cannot remove truly isolated cells (cf. c)). Adding limited apoptosis (130 cells over entire simulation) can eliminate these cells and leads to an additional improvement. Displayed is the development after t = 180 min averaged over 10 simulations for each value of pDirMig, with pDirMig = 0.02 and pDirMig = 0.2 (cf. Fig 4) highlighted.
|