Figure 5—figure supplement 1.

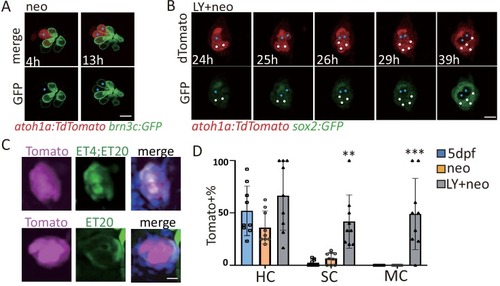
Atoh1a+ cells became SCs and MCs post severe injury.

(A) The Neo-treated atoh1a:TdTomato;brn3c:GFP larvae was imaged for time lapse. Results showed that one Tomato+ cell turned into two HCs with membrane-bound GFP post neo (blue dots). (B) The LY+neo-treated atoh1a:TdTomato;sox2:GFP larvae was imaged for time lapse. The blue dots indicate that one Tomato+ cell divided and turned into two sox2:GFP-negative HCs post LY+neo. The white dots indicate that two Tomato+ cells divided and became four sox2:GFP-positive cells post LY+neo. (C and D) The atoh1a:TdTomato;ET4;ET20 larvae were collected at 48 hr post neo or LY+neo. Tomato expressing HCs, SCs and MCs were separately divided by total numbers of each to calculate Tomato+ ratios. The results showed that significantly more Tomato+ SCs were detected post LY+neo compared with neo. In addition, many Tomato+ MCs were detected post LY+neo, but none was detected in 5dpf and neo.

Expression Data

Expression Detail
Antibody Labeling
Phenotype Data

Phenotype Detail
Acknowledgments
This image is the copyrighted work of the attributed author or publisher, and ZFIN has permission only to display this image to its users. Additional permissions should be obtained from the applicable author or publisher of the image. Full text @ Elife