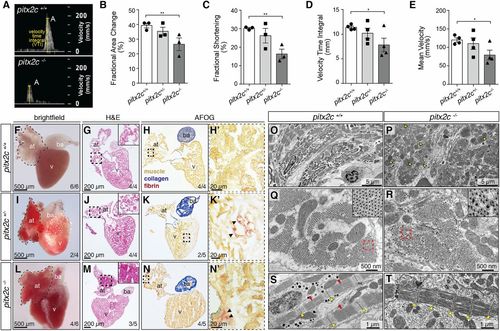
Loss of Pitx2c disrupts cardiac function and structure in adult zebrafish. (A–E) Analysis of cardiac function by echocardiography. Brightfield-Mode (B-Mode) imaging of long-axis views was used to quantify FAC and FS. Pulsed-wave Doppler imaging (A) was used to quantify peak A VTI and mean blood flow velocity (E). Individual data points represent an average measurement taken from 3 diastolic/systolic phases of each fish. All parameters of cardiac function are significantly reduced in pitx2c−/− adults, with variability observed in pitx2c+/− siblings. (F–N) Adult cardiac morphology at 14 months postfertilization (mpf). Dashed lines outline the atrium in whole-mount view of hearts (F, I, and L). Histology was analyzed by hematoxylin and eosin (H&E) staining (G, J, and M; Insets show higher magnification of the boxed region), and fibrosis was analyzed by Acid Fuchsin Orange G (AFOG) staining (H, K, and N; higher magnification of the boxed regions are shown in H’, K’, and N’). pitx2c−/− hearts display enlarged and blood-filled atria (L), and atrial tissue appears hypertrophic (M, Inset). Fibrotic foci are present in the atrium of pitx2c−/− fish (N′; black arrowheads). Intermediate phenotypes were observed in pitx2c+/− hearts. at, atrium; ba, bulbus arteriosus; v, ventricle. (O–T) TEM images of adult pitx2c+/+ and pitx2c−/− atria (n = 3). Areas of highly damaged and necrotic tissue are observed in pitx2c−/− atria, with an increased number of mitochondria that appear enlarged and defective (P; yellow arrowheads). Representative images of cross-sections through myofibril bundles (Q and R; Q, Inset and R, Inset show higher magnifications) and longitudinal sections of sarcomeres (S and T). pitx2c−/− atria exhibit disorganized myofibril bundles and poorly defined Z discs (yellow arrowheads), and M lines (red arrows) are difficult to distinguish (T). Error bars indicate SEM. *P < 0.05 by unpaired t test; **P < 0.01 by unpaired t test.
|
