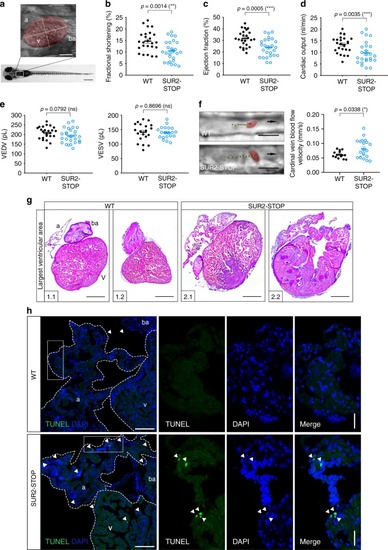
Systolic dysfunction and enlarged heart size in SUR2-STOP zebrafish. a Box designates imaged area to assess cardiac function. The ventricular area of the heart is highlighted, with the long axis and short axis of the ventricle indicated by dashed lines. b–e Quantification of cardiac function using individual characteristic confocal sections from a time series of the embryonic cardiac cycle at 5 dpf. f Tracking of individual red blood cells (RBCs) measuring cardinal vein blood flow velocity. RBCs were tracked for ten frames using ImageJ (NIH) and the plugin MTrackJ68. One representative image of each genotype is shown. Black arrow indicates the direction of RBC movement. g Heart histology of adult SUR2-STOP mutants and respective siblings after H&E staining. Exemplary depiction of 2 WT and 2 SUR2-STOP hearts. For assessment of ventricular chamber size, tissue sections showing the largest ventricular area were selected. h TUNEL assay on adult hearts to detect apoptotic cells (white arrowheads) in WT and SUR2-STOP fish. Heart chambers are indicated by white dashed line. Nuclei are stained with DAPI. All experiments were performed comparing SUR2-STOP and its WT siblings. For all graphs, significance was determined by two-tailed unpaired Student’s t test or Mann–Whitney two-tailed U test. Asterisks indicate statistical significance (*p ≤ 0.05; **p ≤ 0.01; ***p ≤ 0.001; ****p ≤ 0.0001). The black horizontal bar indicates the mean value for each condition. Sample size, WT, n = 20; SUR2-STOP, n = 20 in b–e; WT, n = 14; SUR2-STOP, n = 21 in f; WT, n = 6; SUR2-STOP, n = 6 in g and h. Scale bars, 1 mm and 50 μm in a; 10 μm in f, 500 μm in g; 100 μm (overview) and 50 μm (close up) in h. All embryos analyzed originated from group matings of adult zebrafish. a atrium, ba bulbous arteriosus, v ventricle. The data from individual experiments shown as dots alongside mean ± SEM. Source data are provided as a Source Data file
|

