
Figure 1-S1
- ID
- ZDB-FIG-191230-401
- Publication
- Wong et al., 2019 - Synaptic mitochondria regulate hair-cell synapse size and function
- Other Figures
- All Figure Page
- Back to All Figure Page
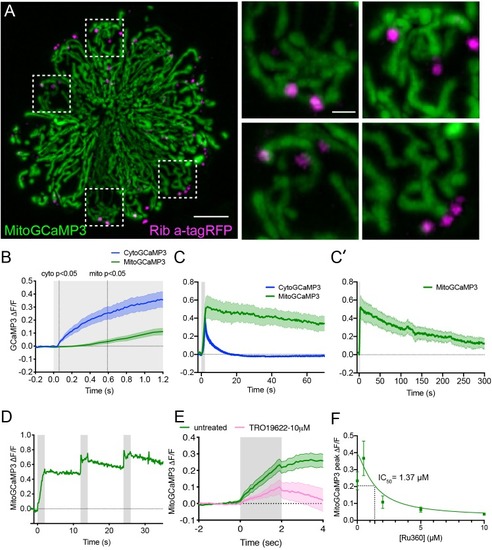
The time course of mechanically-evoked mito-Ca2+ signals are longer-lasting than cyto-Ca2+signals.(A) Airyscan confocal image of a live neuromast expressing MitoGCaMP3 (mitochondria) and Ribeye a-tagRFP (ribbons) at 6 dpf. Insets show the base of 4 individual hair cells from the neuromast in A (dashed white boxes). (B) Average cyto-Ca2+ (blue) and mito-Ca2+ (green) ∆F/F GCaMP3 signals during the onset of a 2 s stimulus. Mito-Ca2+ signals rise with a delay compared to cyto-Ca2+ signals, 3–6 dpf, n ≥ 18 cells. (C-C’) Average cyto-Ca2+ and mito-Ca2+ ∆F/F GCaMP3 signals during and after a 2 s stimulation shows that cyto-Ca2+ signals return to baseline shortly after stimulation (C) while mito-Ca2+ remains elevated up to 5 min after stimulation (C–C’), 3–6 dpf, n ≥ 7 cells. (D) A series of 3, evoked 2 s stimuli initiated at: t = 0–2, 12–14 and 24–26 s. A rise in MitoGCaMP3 can be detected during each stimulus, prior to MitoGCaMP3 signals returning to baseline. (E) 10 µM of the VDAC inhibitor TRO 19622 partially blocks evoked MitoGCaMP3 signals, 5 dpf, n = 15 cells. (F) A dose response curve indicates that Ru360 blocks evoked MitoGCaMP3 signals with an IC50 value of 1.37 µM at 5 dpf, n ≥ 9 cells per dose. Error in panel (B-C’) E and F represent SEM. Scale bar = 5 µm in A and 2 µm in inset. |