
Fig. S6
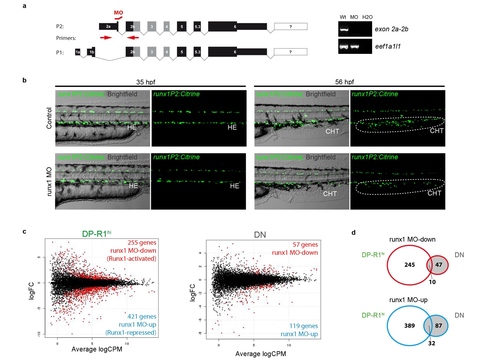
Set-up of a runx1 MO based gene expression screen (a) Left: Schematic of the alternative transcripts derived from the two alternative promoters P1 and P2 and the binding site for the used P2-specific runx1 splice-MO. Right: Typical agarose gel for the analysis of the splice-MO functionality using indicated primers. (b) Fluorescent microscopic images of TgBAC(runx1P2:Citrine) embryos either un-injected (control) or runx1 MO injected. Left: Showing the trunk region including the DA of 35 hpf embryos. Right: Showing the caudal haematopoietic tissue (CHT) region of 56 hpf embryos. (c) Smear plot result of differentially expressed gene analysis (DEG) between runx1 MO and control embryos. Left: DEG analysis for cells of the DP-R1hi gate showing significantly down-regulated (red; Runx1-activated) and up-regulated (blue; Runx1 repressed) genes. Right: DEG analysis for cells of the DN gate showing significantly down-regulated (red) and up-regulated (blue) genes. (d) Gene list intersection between DEG detected in cells of the DP-R1hi and DN gates after runx1 MO injection. Top: Intersection between genes down-regulated due to runx1 MO injection in both populations. Bottom: Intersection between genes down-regulated due to runx1 MO injection in both populations. |