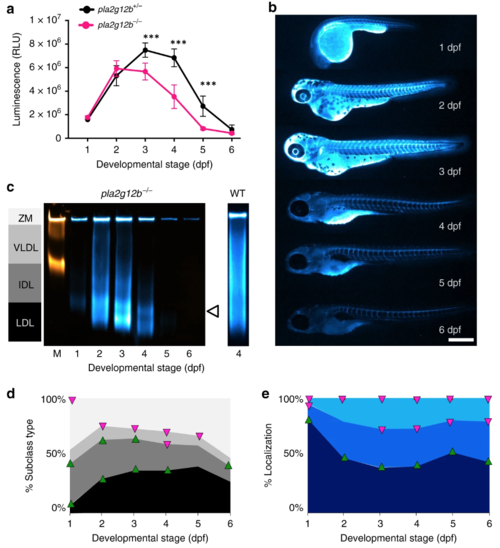
LipoGlo reveals profound alterations in the apolipoprotein B-containing lipoprotein (ApoB-LP) profile in pla2g12b−/− mutant larvae. a Comparison of LipoGlo signal between pla2g12b−/− and pla2g12b+/− siblings during larval development (1–6 days post fertilization (dpf)) (degrees of freedom (DF) = 11, n ≈ 11, two-way robust analysis of variance (ANOVA) p < 0.0001 for genotype and stage, Games–Howell p < 0.0001). b Representative images (n = 15) of ApoB-LP localization collected by LipoGlo chemiluminescent imaging throughout development (1–6 dpf), and e quantification of percent localization into previously described subregions (DF = 11, n = 15, two-way robust ANOVA p < 0.001 for all regions, Games–Howell p < 0.0001). cRepresentative gel (n = 4) showing production of abnormally small lipoproteins (white arrowhead) and d quantification of LipoGlo emission pattern from Native-polyacrylamide gel electrophoresis (Native-PAGE) samples in pla2g12b−/− larvae (1–6 dpf). Upward-facing arrowheads (green) indicate significant enrichment of that species at that time point compared to WT, and downward-facing arrowheads (magenta) indicate depletion using the Games–Howell test with a threshold of p < 0.05 (DF = 11, n = 9, two-way robust ANOVA p < 0.001 for all species, Games–Howell p < 0.01). Results represent pooled data from three independent experiments, “n” denotes number of samples per data point. *** denotes p < 0.0001.
|
