
Fig. 6
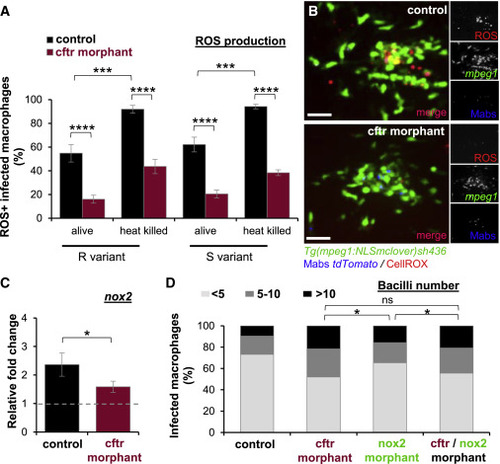
CFTR Modulates NADPH Oxidase-Mediated ROS Production (A and B) mpeg1:NLSmclover controls or cftr morphants were infected with either living or heat-killed Mabs R or S expressing tdTomato into the muscle and stained for ROS production using CellROX deep red and analyzed using confocal microscopy. (A) Proportion of ROS-positive infected macrophages at 2 hpi (n = 16, two experiments). (B) Distribution of representative ROS-producing macrophages within the muscle at 2 hpi. Scale bars, 15 μm. (C) qRT-PCR measurement in whole embryos i.v. infected with Mabs and plotted as fold increase over mock injection for nox2. Mean relative ± SEM gene expression of three independent replicates. (D) mpeg1:NLSmclover controls, cftr, nox2, and double cftr/nox2morphants were i.v. infected with Mabs expressing tdTomato, and intracellular bacterial loads were quantified at 1 dpi using confocal microscopy. Graph represents the average proportions of infected macrophages containing fewer than five, five to ten, or more than ten bacteria in the CHT (n = 15, two experiments). |
| Gene: | |
|---|---|
| Fish: | |
| Condition: | |
| Knockdown Reagent: | |
| Anatomical Term: | |
| Stage: | Prim-15 |
| Fish: | |
|---|---|
| Condition: | |
| Knockdown Reagent: | |
| Observed In: | |
| Stage: | Prim-15 |