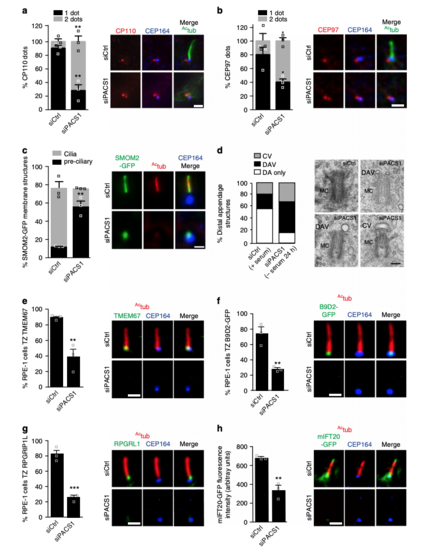
Fig. 5
|
PACSIN1 functions at the CV stage prior to CP110 loss. a Quantification of CP110 dots in serum starved RPE-1 cells treated with siRNAs for 72 h, serum starved for the last 24 h, and stained with CP110, Actub and CEP164 antibodies. CP110 localization on both centrioles (2 dots) or only the daughter centriole (1 dot) was quantified (left panel, siCtrl = 100, siPACS1 = 63 cells). b Quantification of CEP97 dots in cells treated as in a and stained with CEP97, Actub, and CEP164 antibodies. CEP97 localization on the centrioles was quantified as in a(siCtrl = 201, siPACS1 = 125 cells). c Quantification of SMOM2-GFP centrosomal accumulation in cells treated as in a, and stained with Actub and CEP164 antibodies. “Preciliary” indicates SMOM2-GFP vesicle accumulation at the MC without axonemes (siCtrl = 100, siPACS1 = 67 cells). Scale bar: 2 μm for images in a–c. d Quantification of MC with non-ciliary distal appendages structures from cells treated as in a. Pooled data from 3 independent experiments (siCtrl = 56, siPACS1 = 41 cells). Representative electron micrographs of quantified MCs shown on right. Scale bar: 200 nm. MC mother centriole, DAV distal appendages vesicles, CV ciliary vesicle, or DA non-membrane-associated distal appendages. e–g Quantification of TZ accumulation of TMEM67 (e, siCtrl = 113, siPACS1 = 89 cells), B9D2-GFP (f, siCtrl = 365, siPACS1 = 250 cells), RPGRIP1L (g, siCtrl = 70, siPACS1 = 63 cells) in cells treated as in a. h mIFT20-GFP cells treated as in a, stained with Actub and CEP164 antibodies, and quantified for mIFT20 fluorescence intensity at the MC/BB (siCtrl = 46, siPACS1 = 43 cells). Scale bar: 2 μm for images in e–h. In a–c, and e–h, representative images of quantified cells shown on right and means ± SEM, n = 3 independent experiments. Two-tailed t-test analysis as compared with siCtrl was performed. **P < 0.001, ***P < 0.0001 |

