
Fig. 1
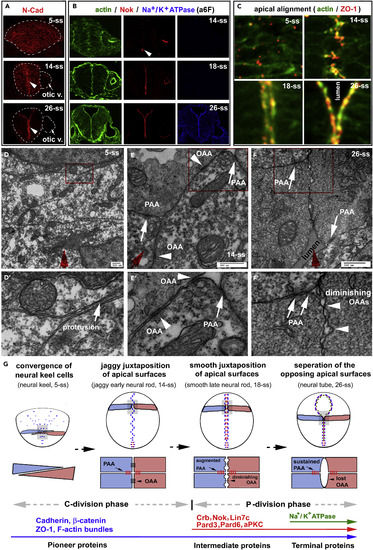
Three-Step Localizations of Apical Polarity Proteins Correlate with the Dynamics of Apical Cell-Cell Adhesions during Zebrafish Neurulation (A) Pioneer proteins N-Cad, visualized by immunohistochemistry, distributed ubiquitously on the cell membranes at 5-ss and then enriched apically (arrowheads) at 14-ss and 26-ss. Arrows, the otic vesicle. (B) Simultaneous staining of F-actin bundles, Nok, and Na+/K+ ATPase at 14-ss, 18-ss, and 26-ss. Note the lack of Nok signals in the neural tissue at 14-ss, except at the ventral end (arrowhead), and the lack of Na+/K+ ATPase apical enrichment at 14-ss and 18-ss. (C) The F-actin bundles and ZO-1 (in the gray areas in G) scattered in the neural keel (5-ss), aligned jaggedly in the early neural rod (14-ss), and aligned smoothly in the late neural rod (18-ss) and the neural tube (26-ss). (D–F and D′–F′) TEM revealed the dynamics of the PAAs and OAAs at the midline region during neurulation: no apparent electron-dense cell-cell junctional complexes in the neural keel at 5-ss (D and D′); apparent electron-dense PAAs (white arrows) and OAAs (white arrowheads) in the jaggy early neural rod at 14-ss (E and E′); and diminishing OAAs and persistent PAAs in the smooth late rod at 18-ss or the neural tube region where apical surfaces still juxtaposed at 26-ss (F and F′). D′–F′ are magnifications of the local regions boxed in D–F, respectively. The red arrows indicate the midline axis, which was defined as the dorsal-ventral central axis of the cross sections of the entire tissues under low magnifications. (G) Diagrams summarize the spatiotemporal localization order of pioneer, intermediate, and terminal proteins; the morphological changes of apical surface alignments; the dynamics of the PAAs and OAAs,; and the switch from cross-midline cell division mode (C-division) to parallel cell division mode (P-division) during the “neural keel-jaggy early neural rod-smooth late neural rod-neural tube” transition. Blue and magenta illustrate neuroepithelial cells of opposite orientations. Also see Figure S1. |
| Antibodies: | |
|---|---|
| Fish: | |
| Anatomical Terms: | |
| Stage Range: | 5-9 somites to 26+ somites |