
Fig. 1
- ID
- ZDB-FIG-180712-40
- Publication
- Shibata et al., 2018 - Heterogeneous fates and dynamic rearrangement of regenerative epidermis-derived cells during zebrafish fin regeneration
- Other Figures
- All Figure Page
- Back to All Figure Page
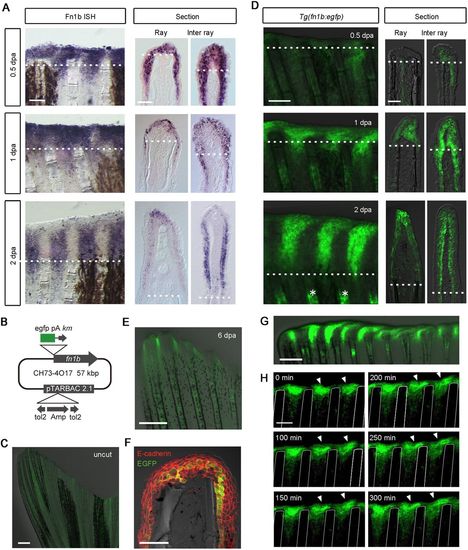
Imaging of RE cells in Tg(fn1b:egfp) during fin regeneration. (A) Whole-mount in situ hybridization analysis of fn1b expression at 0.5, 1 and 2 dpa. Respective sections through the ray or inter-ray regions are shown on the right. fn1b was strongly induced in the RE by 1 dpa, and particularly in the inter-ray epithelium after 2 dpa. The dotted lines indicate the amputation plane. Scale bars: 100 µm (left); 50 µm (right). (B) Map of the BAC construct used to generate the Tg zebrafish. The egfp cassette was inserted by homologous recombination at the initiation site of the fn1b gene in the CH73-4O17 BAC. The tol2 cassette, which carries inverted orientations of the tol2 sequence and the intervening ampicillin resistance gene (Amp), were introduced within the pTARBAC2.1 vector. pA, polyadenylation sequence; km, kanamycin resistance gene. (C) EGFP expression in the Tg fin before amputation. A very low level of EGFP fluorescence was observed throughout the uncut fin. Scale bar: 500 µm. (D) EGFP expression in the Tg fin (left panels) after amputation and their respective sections. The respective sections through the ray or inter-ray regions are shown on the right. The dotted line indicates the amputation plane. Scale bars: 100 µm (left); 50 µm (right). The asterisks show EGFP expression in the fin ray mesenchyme. (E) EGFP expression at 6 dpa. EGFP expression decreased after 2 dpa, and became weak at 6 dpa. Scale bar: 500 µm. (F) Immunohistochemical detection of E-cadherin (red) and EGFP (green) in a fin section of Tg(fn1b:egfp) at 1 dpa. Scale bar: 50 µm. (G) Whole-mount image of the regenerating Tg fin at 2 dpa. Scale bars: 200 µm. It appears that EGFP+ cells are recruited from the inter-ray regions and move laterally to cover the ray regions. For A,C-G, n>5 fins (A) or sections (C-G). (H) Time-lapse analysis of EGFP+ cells in the Tg(fn1b:egfp). Images were captured every 5 min from 24 to 29 hpa (n=3 fins). Only the images at 0, 100, 150, 200, 250 and 300 min are shown. The arrowheads indicate representative EGFP+ cells that may migrate from the inter-ray to the ray region. The white lines indicate the outlines of the fin rays. Scale bar: 100 µm. |