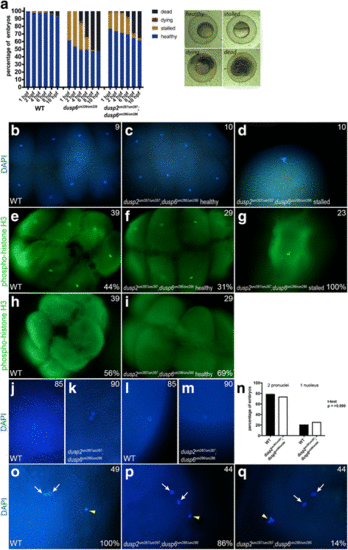
Fig. 5
|
A fraction of dusp6 homozygous mutant embryos stall at the first cell division. a Wildtype, dusp6 mutant (derived from crosses between dusp6 um239/um239 females and dusp6 um239/um239 males), and dusp2/dusp6 double mutant (derived from crosses between dusp2 um287/um287 ;dusp6 um286/um286 females and dusp2 um287/um287 ;dusp6 um286/um286 males) clutches were monitored throughout early development and the health of each embryo scored at each time point according to the brightfield images to the right (a minimum of three clutches were scored for each cross). Average cumulative counts are shown. b-d DAPI staining on 1hpf wildtype and dusp2/dusp6 double mutant (derived from crosses between dusp2 um287/um287 ;dusp6 um286/um286 females and dusp2 um287/um287 ;dusp6 um286/um286 males) embryos to visualize the nuclei. e-i Immunostaining for phospho-histone H3 to visualize mitotic nuclei of wildtype and dusp2/dusp6 double mutant (derived from crosses between dusp2 um287/um287 ;dusp6 um286/um286 females and dusp2 um287/um287 ;dusp6 um286/um286 males) embryos. j-m DAPI staining at 10 min post fertilization of wildtype and dusp2/dusp6 double mutant (derived from crosses between dusp2 um287/um287 ;dusp6 um286/um286 females and dusp2 um287/um287 ;dusp6 um286/um286 males) embryos to visualize the early pronuclei. n Quantification of wildtype and dusp2/dusp6 double mutant (derived from crosses between dusp2 um287/um287 ;dusp6 um286/um286 females and dusp2 um287/um287 ;dusp6 um286/um286 males) mutant embryos containing one or two pronuclei. A t-test yields a p-value of > 0.999 indicating no significant statistical difference. o-q DAPI staining to detect polar bodies in wildtype and dusp2/dusp6 double mutant (derived from crosses between dusp2 um287/um287 ;dusp6 um286/um286 females and dusp2 um287/um287 ;dusp6 um286/um286 males) embryos at 10 min post fertilization. White arrows indicate pronuclei and yellow arrowheads indicate polar bodies in (o-q). Numbers in top right corner of each panel indicate the total number of embryos assayed for that condition. Numbers in bottom right corner indicate percent of embryos with the phenotype shown |
| Fish: | |
|---|---|
| Observed In: | |
| Stage Range: | 1-cell to Bud |

