
Fig. 4
- ID
- ZDB-FIG-180611-88
- Publication
- Burkhard et al., 2018 - Spatially resolved RNA-sequencing of the embryonic heart identifies a role for Wnt/β-catenin signaling in autonomic control of heart rate
- Other Figures
- All Figure Page
- Back to All Figure Page
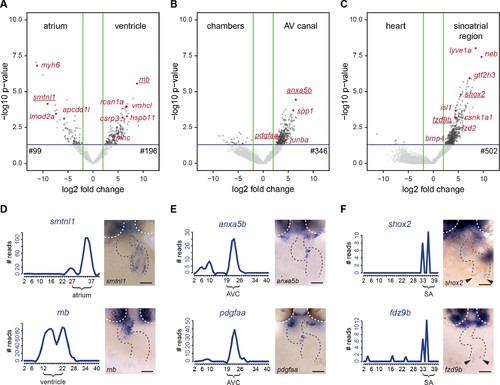
Differentially expressed genes in cardiac sub-compartments. (A–C) Volcano plots highlighting genes differentially expressed in the (A) atrium (n = 99) and ventricle (n = 196), (B) AV canal (n = 346) and (C) sinoatrial region (n = 502). Grey and red dots represent individual genes. Green lines indicate threshold of log2 fold change >2. Blue lines indicate threshold of p-value<0,05. (D–F) Expression traces and in situ hybridization analysis for representative example genes (gene names underlined in volcano plots) significantly upregulated in (D) atrium (smtnl1) and ventricle (mb), (E) AV canal (anxa5b and pdgfaa) and in the sinoatrial region (shox2 and fzd9b). Smoothening (LOESS) was applied to graphs D and E, span α = 0.2. Gray dashed line outlines the heart. White dashed line outlines the eyes. Anterior up. Scale bars represent 50 μm. See also Figure 4—figure supplement 1 and Figure 4—source data 1. |
| Genes: | |
|---|---|
| Fish: | |
| Anatomical Terms: | |
| Stage Range: | Long-pec to Protruding-mouth |