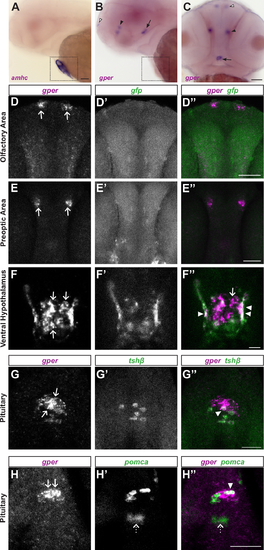
gper expression in the brain and pituitary. (A-C) Whole mount colorimetric in situ hybridization was performed on wildtype embryos at 50 hours post fertilization (hpf). (A) amhc (alpha-myosin heavy chain) antisense RNA labels atrial myocardial cells in the heart (boxed). (B, C) gper antisense RNA labels a bilaterally symmetric cluster of cells in the olfactory area (white arrowheads) and preoptic area (black arrowhead) and a medial cluster of cells in the ventral hypothalamus (arrows). No label was detected in the heart. Lateral views with anterior to the left (A,B), ventral view with anterior to the top (C), scale bars = 100 μm. (D-F) Double fluorescent in situ hybridization performed on 48 hpf Tg(5xERE:GFP)c262 embryos following overnight exposure to 100 ng/ml estradiol. gfp marks cells with active nuclear estrogen receptors. Confocal images of selected Z-slices (0.975 μm) show that gper is expressed in the olfactory area (D) and preoptic area (E) in cells lacking gfp (D”, E”, scale bars = 50 μm). In the ventral hypothalamus (F), gper is expressed in a medial cluster of cells lacking gfp (arrows, F, F”), whereas gper is expressed together with gfp more laterally (arrowheads, F”, scale bar = 10 μm). (G-H) Double fluorescent in situ hybridization performed on 48 hpf wild-type embryos. Confocal images of selected Z-slices (0.975 μm) show that gper is expressed in the middle zone of the pituitary (G, arrows), together with tshb-positive thyrotropes (G”, arrowhead). gper is expressed in the anterior zone (H, arrows) together with pomca-positive corticotropes (H”, arrowhead). gper was not detected in the posterior zone of the pituitary, marked by a distinct population of pomca-positive cells (dotted arrows, H’, H”). Scale bars = 50 μm, dorsal views, anterior to the top. In merged images, gper is magenta, gfp is green and areas of colocalization are white.
|
