Fig. 2
- ID
- ZDB-FIG-180315-45
- Publication
- Ripa et al., 2017 - MicroRNA miR-29 controls a compensatory response to limit neuronal iron accumulation during adult life and aging
- Other Figures
- All Figure Page
- Back to All Figure Page
|
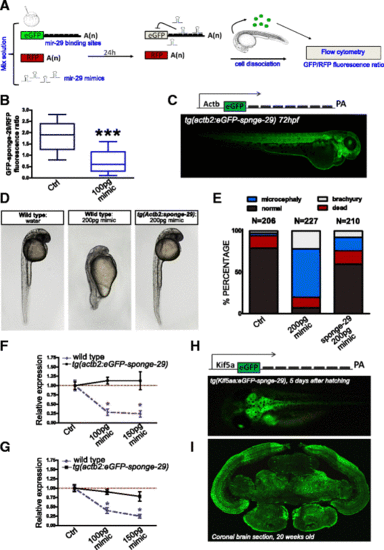
Generation of mir-29 loss of function N. furzeri. a Scheme of the reporter assay for miR-29 activity. Green fluorescent protein (GFP) mRNA carrying multiple miR-29 binding sites is injected in one-cell stage zebrafish embryos along with red fluorescent protein (RFP) mRNA, as a loading control, and miR-29 mimics. Control embryos are injected with same mix without miR-29 mimics. Binding of miR-29 mimics to reporter mRNA causes repression of GFP signal. At 24 hours post injection embryos are dissociated (n = 30–40) and cells relative fluorescence is read by flow cytofluorescence. b Fluorescence cell analysis. MiR-29 mimics strongly reduced eGFP-sponge signal (***P < 0.001, T-test). Whisker plots indicate the 10%, 25%, median, 75%, and 90% ranges. c On the top the expression cassette, consisting of 5.3 kb of zebrafish actb2 promoter, eGFP fused to a synthetic 3′-UTR containing seven repetitions of miR-29 binding site, and a SV40 late poly-A tail is reported. A tg(actb2:eGFP-sponge-29) F1 embryo generated by Tol2-mediated transgenesis is shown at the bottom. d, e Wild-type and F1 transgenic zebrafish were injected with 200 pg of miR-29a or miR-29b mimics at the one cell stage, control embryos were injected with water and red phenol only. Picture (d) shows representative control embryos, wild-type embryos +200 pg mimics, transgenic embryos + 200 pg mimics at 24 hpf. Stacked bar chart (e) represent the percentages of embryos with different phenotypes (normal, death, microcephaly, and brachyury) in the three conditions. f, g Expression level at 24 hpf of Col11a1, Elna, Ireb2, and Tfr1a upon miR-29 mimic injections. One-stage wild-type and sponge-29 line were injected with different doses (100 and 150 pg) of microRNA mimics and the expression level determined by RT-qPCR. Statistical significance was assessed by one-way ANOVA with post-hoc Tukey’s test (*P < 0.05), the analysis was performed on total RNA extraction from 30–40 embryos for each condition. Error bars indicate standard errors of means. h Schematic representation of sponge expression cassette driven by 3.1 kb of kif5aa promoter and the tg(kif5aa:eGFP-sponge-29) f1 killifish embryo, 5 days after hatching. i eGFP immunodetection on tg(kif5aa:Egfp-sponge-29) 20-week-old killifish brain section |

